
Milestones on Stacked Bar Graphs and other report options

 +1
+1
We are currently using stacked bar graphs for various reports to help get at a total volume of data while also segmenting it out. One of the drawbacks is that we are not able to add milestones to this graph. What is the reasoning behind milestones not being viable with a stacked bar graph? Is this on the roadmap?

Userlevel 7
 +2
+2
Hi Samantha, do you have an example of the kind of report you are trying to build? Like the source object, fields to show, grouping and filters?
+1
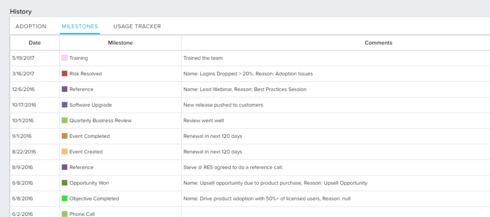
The report we are looking at is from an MDA table and shows two fields (see screenshot below). We have variations of this report that are grouped by week (which we receive the data in weekly increments), month, and quarter. The only filters applied are date ranges.
We stack the data to get the idea of the total document volume and provide CSMs the ability to quickly see where the failure rates increase.

We stack the data to get the idea of the total document volume and provide CSMs the ability to quickly see where the failure rates increase.
Userlevel 7
+2
Gotcha. And so that I'm sure I understand - when you say "Milestones" are you referring to the data from the Milestone table in Gainsight (and which appears in the usage history section of the C360)?
Or did you have something else in mind?
Or did you have something else in mind?
+1
Yes, just the milestones logged in the 'Milestone' table. The ability to toggle them on/off within the reports setting is not present when viewing stacked bar graphs.
Userlevel 7
+2
I follow you now. I had to go deep into our documentation (linked here) to remind myself about this feature. I had forgotten about the ability to add a milestone overlay to any reports that are added to a C360 layout. :)
It does look limited to Line, Area, Bar, and Column charts. I'll tag our reporting product owner to see if he has any additional input.
It does look limited to Line, Area, Bar, and Column charts. I'll tag our reporting product owner to see if he has any additional input.
Reply

Sign up
If you ever had a profile with us, there's no need to create another one.
Don't worry if your email address has since changed, or you can't remember your login, just let us know at community@gainsight.com and we'll help you get started from where you left.
Else, please continue with the registration below.
Welcome to the Gainsight Community
Enter your username or e-mail address. We'll send you an e-mail with instructions to reset your password.