


As you build and launch your many amazing PX Engagements inside your web and mobile applications, it is 100% normal for some of them to perform wonderfully with high completion rates and calls to action (button clicks), while others tend to fall flat on their faces.

Of course, there can be many reasons for this, such as the messaging was not clear/compelling, the guide/slider was too long, the in-app Engagement was launched in the wrong place at the wrong time, you targeted the wrong type of users/customers … the list goes on and on.
If you have not already read our “In-App Engagement Starter Kit” or just need a refresher, definitely check out our “TRUSt Framework” that discusses our best practice recommendations for building effective in-app Engagements.
For brand new in-app Engagements … and even some of your currently active in-app Engagements … you can definitely measure and improve their efficacy through A/B testing. This Community post is intended to give you a good example of how you can easily and quickly do this on your own with PX.
Setting up your PX Engagements (3 steps)…
1) First, create two (or more) different PX Engagements that are intended for the same purpose. In this example, these PX Engagements are intended to increase the user awareness/adoption of a specific Feature within your application.
2) Then, within the PX Engagement “Schedule” -> “Qualification Scope” configuration section there is an additional option under the Engagement Sampling setting to Engage a group of “Users” or “Accounts” by their randomly assigned group numbers between 1-100. While you cannot currently see these “Group” numbers in the PX application for Users or Accounts, they really do exist in our backend.
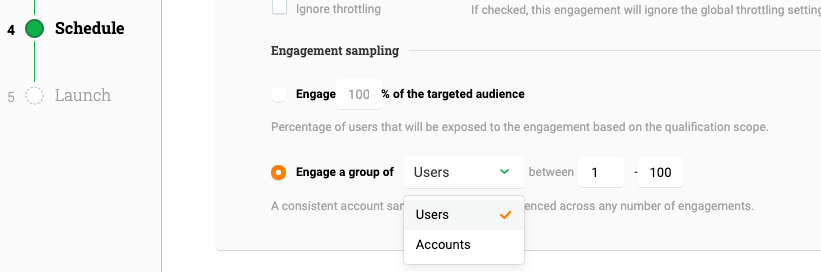
For PX Engagement #1, choose the Users/Accounts between 1 - 50. (“A” sample group)
For PX Engagement #2, choose the Users/Accounts between 51 - 100. (“B” sample group)
Pro tip:
To be statistically valid, you should also consider adding a “control group” to your testing process so that a portion of your users will NOT see either of these PX Engagements. In this way, you will not only be able to determine which of your PX Engagement variants is better at driving the intended results, but you will also be able to measure their cumulative effect compared to users that were not offered either PX Engagement. In this case, you can use group settings similar to below:
PX Engagement #1, choose the Users/Accounts between 1 - 33. (“A” sample group)
PX Engagement #2, choose the Users/Accounts between 34 - 66. (“B” sample group)
Control Group not used in either PX Engagement , Users/Accounts between 67 - 100
3) Last, and most importantly, “Launch” your Engagements so that PX can start serving these to your users and collecting all the in-app Engagement performance analytics that we will use in the next step.
Analyzing the results…
After the Engagements have been launched and are being consumed, you can easily view and compare/contrast the actual statistical results in PX’s In-app Performance Engagement Analytics.
In this sample screenshot, you can see that both Engagements were viewed many times. However, PX Engagement #2 had a much higher completion rate and generated more Calls to Action (button clicks) than PX Engagement #1. 
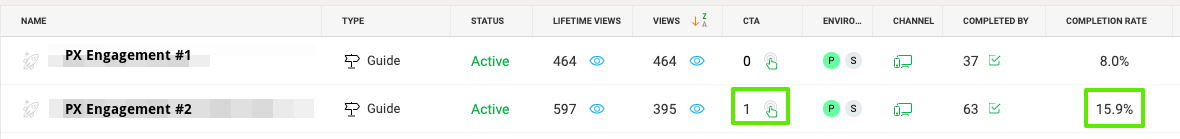
So, in this particular case PX Engagement #2 is the “winner” and could be a very good, proven design and methodology for building your future PX Engagements. 
Additionally to measure the effectiveness of these PX Engagements on their desired purpose … as a reminder in this scenario it was to increase the user awareness/adoption of a specific Feature within your application .... you should create a new custom PX Dashboard.
On your new custom PX Dashboard, add at least three separate Feature Performance widgets that will use filters to analyze overall Feature usage based on the following criteria:
-
The first widget will show all users that accessed the Feature, whether they received the PX Engagement or not.
-
The second widget uses a filter to only show those users that Completed the PX Engagement
-
The third widget uses a filter to only show those users that did not View the PX Engagement
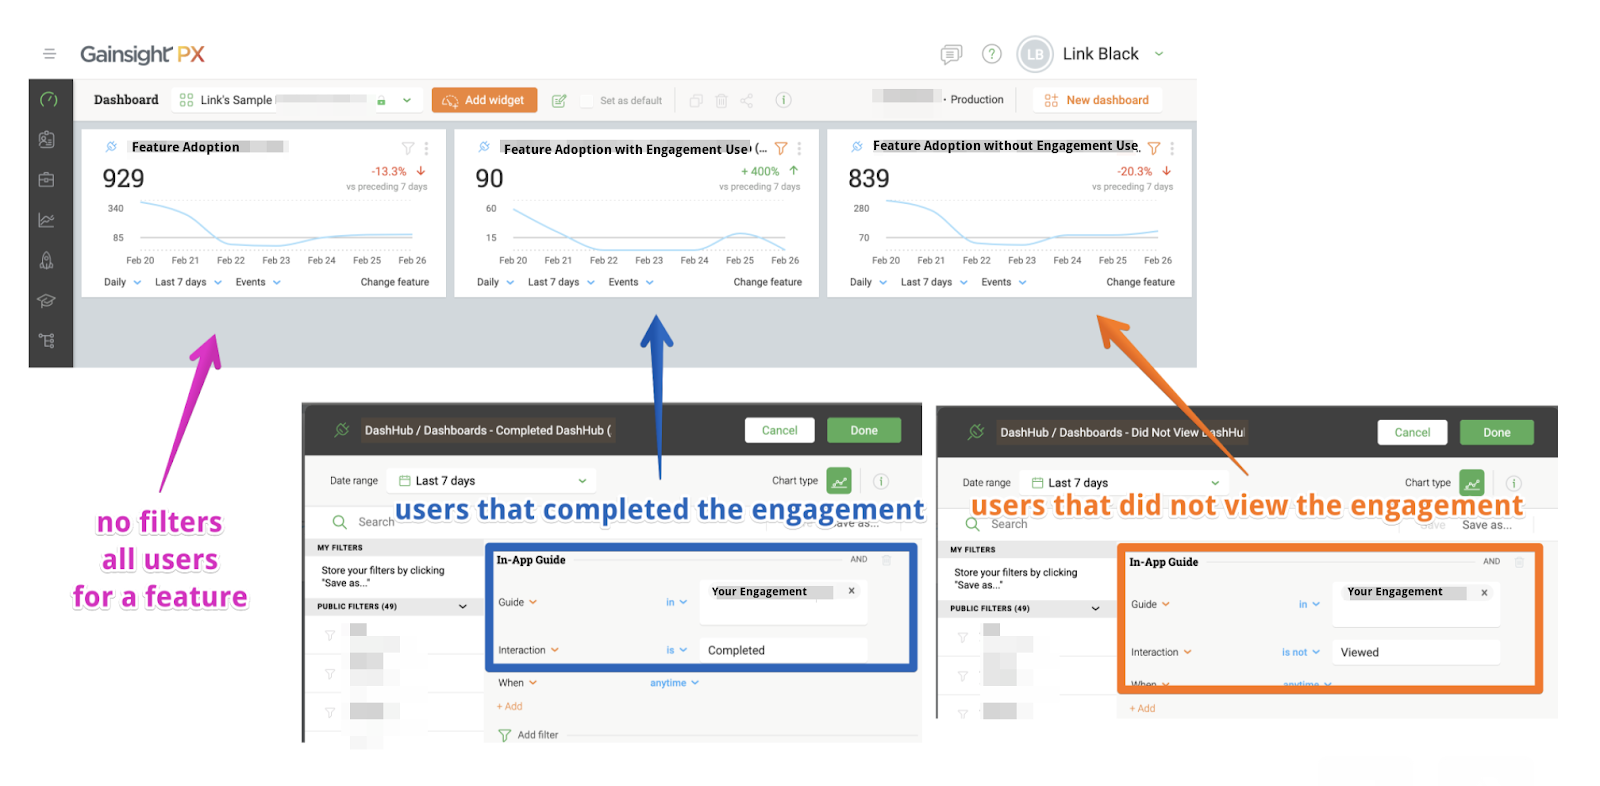
So, at least in this particular case, overall usage of this application Feature is down -13% this week compared to last week.  However, for users that “Completed” the PX Engagement their usage of this application Feature is up a whopping +400% this week compared to last week.
That is a significant increase and in this case shows the true power and positive effects of using in-app PX Engagements to drive user awareness/adoption of a specific Feature within your application.
I hope this Community post helps you to execute your own A/B testing of PX Engagements!
Happy PX-ing!!!!


