


My company has been tracking accounts at risks using 4 separate picklist fields at the Company level: Primary Risk Theme, Primary Risk Sub-reason, Secondary Risk Theme, Secondary Risk Sub-reason.
I am moving them over to the CTA framework to allow more flexibility long term, but they still desire this concept of Primary and Secondary themes.
For this, I am using Reporting Category. When they select a Reason, the Reporting Category automatically gets set to one of the 6 core themes.
To distinguish between Primary vs. Secondary, I am instructing them to leverage the Priority (High = Primary, Medium = Secondary)
Trying to figure out how to build a report that will show the number of companies where themes (Reporting Categories) overlap as either Primary or Secondary, to try and identify correlations.
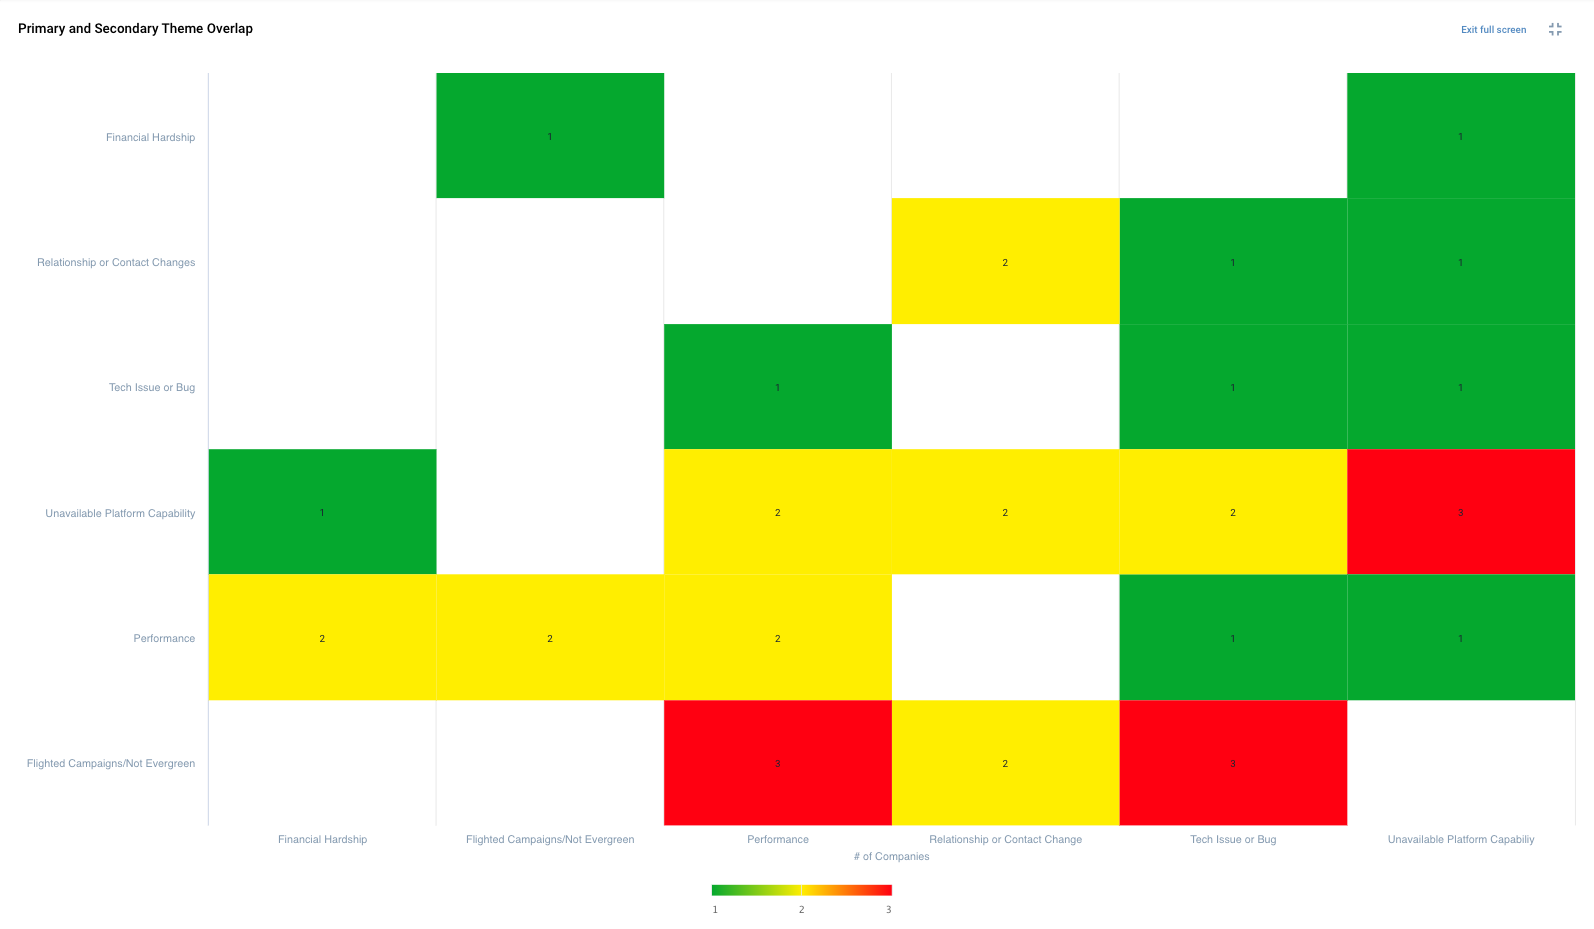
Previously we had a report like this, when using the separate picklist fields for Primary and Secondary:
Racking my brain but cannot figure out how to do something like this via Data Designer. Anyone have any suggestions?

