
As I was training, I found a way to explain it simply that really seemed to click with everyone! I thought I'd share in case others are working to increase adoption at their orgs.
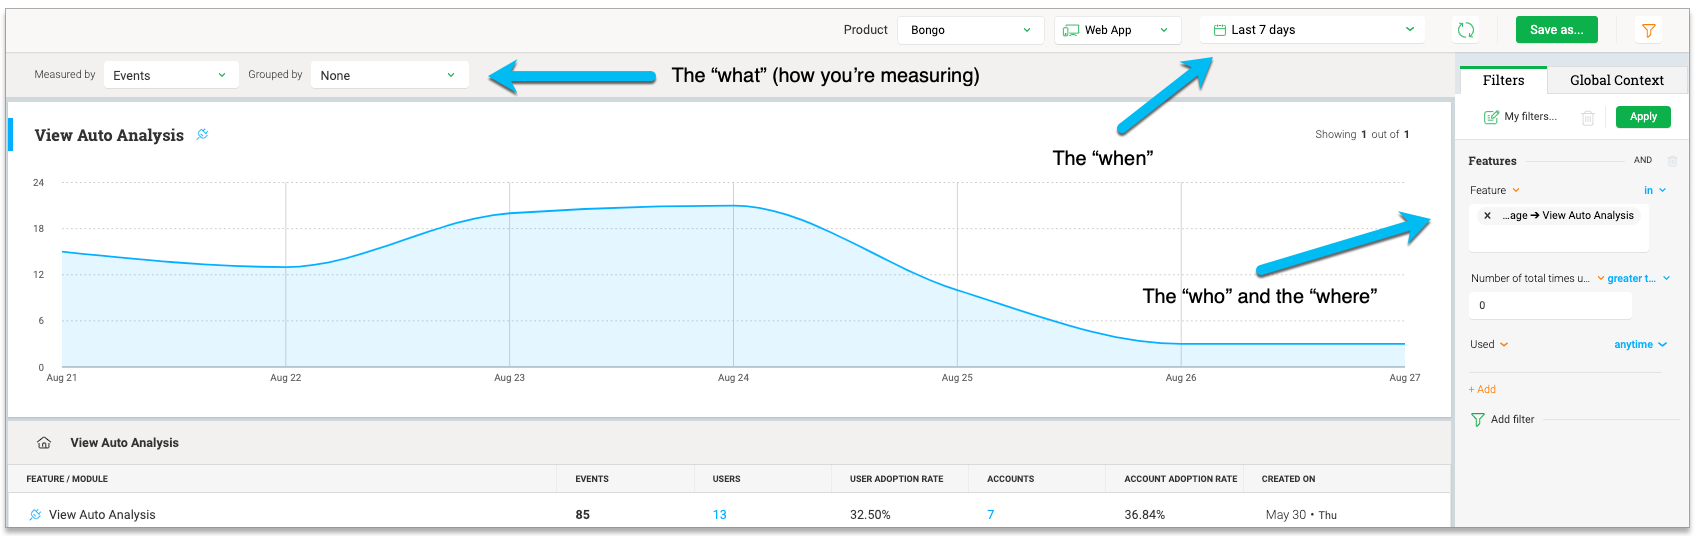
- The "what"
- How you're measuring - what are you actually wanting to see? Do you want to know the number of times that something has happened, or the number of users/accounts who have done something? Do you want to know the totals of those numbers, or do you want to understand how the total is distributed among top features, users, countries, accounts, etc?
- The "when"
- What time frame do you want to filter the data by - 7 days? 8 weeks? 6 months?
- The "who" and the "where"
- "Who" - which subset users? New users? Users that saw certain PX engagements? Do you want to look at specific accounts?
- "Where" - where in the product do you want to focus? Do you want to see users who have used a feature more than 10 times?
Hope that's useful to others!


