Solved

Dashboard grouping - quarter over quarter, per year (stacked)

  • 31 March 2022
  • 3 replies
  • 123 views

Badge +1

Hey all,

has anyone worked out how to stack data, so you can show the results for each quarter, over the past “x” years.


eg. i want to compare my bookings for Q1 2021 vs Q1 2020 vs Q1 2019 vs Q2018


i only seem to be able to group by FQ and that shows it in a linar format, not stacked by year
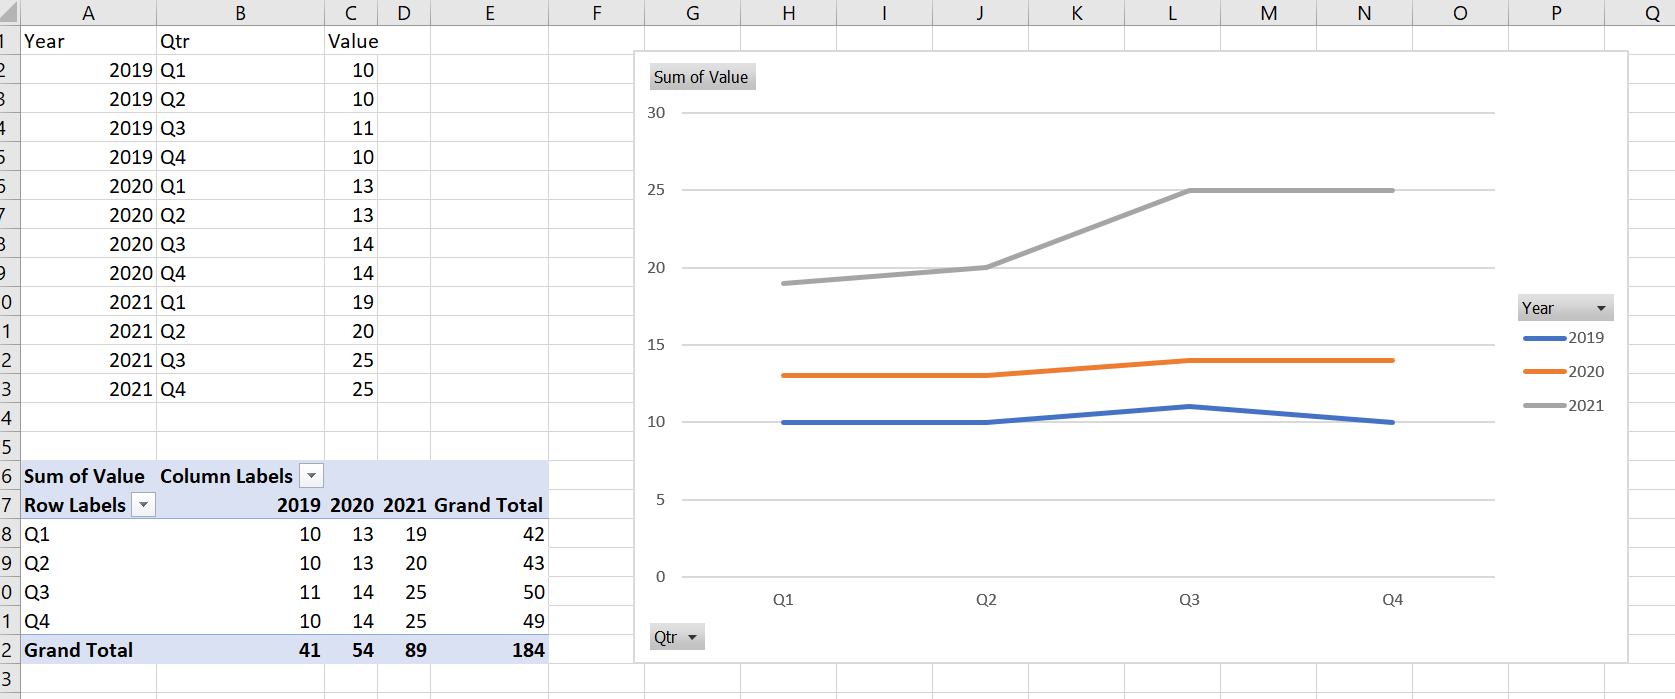
excel example:


icon

Best answer by seth 18 April 2022, 16:08

View original

3 replies

Userlevel 7
Badge +6

Wanted to pass along some thoughts here from @wayne_baker !

Def possible. Two ways you can accomplish this.

Option 1. You take the data from a year ago and store is on today's record. So when you build your report you will have two data points, one for this year and one for last year, in the show me and then by the regular date field. This is a little bit of a different type of report that probably doesn’t solve the use case. This is more for if you only want to compare last years to today's.

Option 2. When the data is pushed to the table you create an additional column that stores "Q1", "Q2", etc based on the date field. Then in your report you put the usage data in the show me and in the by section you put both this new column and date and view it as a stacked bar column.


Although Wayne talks about using a table in Option 2, I feel like you should be able to do all the aggregation you would need in Data Designer, so you wouldn’t need to create an actual table (or add fields to an existing table).

Badge +1

Thanks!

thats just how i did it in the end.

it worked out as i required


Userlevel 7
Badge +6

Great @jamieP !!

Reply