
We are re-doing our health scores and I'm grappling with how best to represent "usage" in a health score. So far I've decided to roll up all of our pageviews, and API calls across 3 different products into an overall usage aggregate number. Then, I tried to use the percentage change function to compare usage of each customer to themselves over the last 4 weeks. Then we can see generally if they are using it more or less than they had been. More == better, right? If they continue to adopt, and grow over time their health scores will remain good. Longer term reductions in overall usage will tell us that something may be going wrong.
My issue with this approach is that if a customer has a big spike in usage for a short period of time, it skews their scores for the next month, dragging them down and making it look like they are less healthy. It also does not take into account any comparison between accounts. ie. customer A fluctuates between 30,000 and 10,000 actions will look less healthy than customer b who has a consistent 10 actions. Which isn't right...
I was thinking about trying to calculate the distribution of customers and try to force them into quintiles of usage. I remember an old scoring 1.0 feature that did this, but not in 2.0...
Wondering what others are doing.
What equation are you using for calculating "usage" of your product?

Userlevel 3


Userlevel 7
 +2
+2
Hi Jason, it usually helps to determine how you will score customer usage health using a excel doc where you can set filters and calculations and determine the impact to your customer community. In your specific example, usage health might be a function of (number of page views or API calls / number of licenses or connections). This way you have a scalable ratio that works for small customers and large ones.
As usage varies from week to week and month to month, you will keep track of the score for each time period but as you noted it can be problematic to actually change the ranges of what is considered red, yellow, or green by incorporating historical information into the mix.
A more methodical approach might be to re-evaluate your health score ranges on a periodic basis (either quarterly or bi-annually) to ensure that a customer that scores a green is still considered in good health.

In addition, (perhaps you were stating this indirectly), you may want to look at segmenting the customer base into general type of users , assuming you have some historical data. Score each segment with a different formula. As you mentioned, users that are "spikey" users and those that are more consistent and perhaps there is one other kind.
Tag/Segment the customers, manually score (Excel or outside of the tool) the segment based on some known healthy and non-healthy to ensure the segmented scoring is working (as Dan mentioned) and then put it into play. Be sure to review in 4 to 6 months.
Tag/Segment the customers, manually score (Excel or outside of the tool) the segment based on some known healthy and non-healthy to ensure the segmented scoring is working (as Dan mentioned) and then put it into play. Be sure to review in 4 to 6 months.
Userlevel 3
I guess I was looking for the actual equation folks are using.
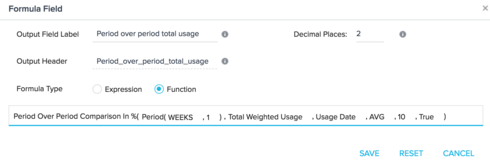
For example, I am taking our pageviews and api calls and adding them all together, then comparing the previous week to the average of the past 10 weeks, ignoring missing data.
(System1 pageviews + System1 Sis1 api calls + System2 pageviews + System2 api calls) = combined usage number
Then, to calculate the score I tie it to this value and scale it -200 to 25, to account for swings in usage. Any increase in usage will lead to higher scores, while a decrease in usage will lead to neutral scores, provided there is some usage.
I'm looking for ideas on how to better score 'usage', as this isn't an ideal solution. Our highest usage customers are in the tens of millions of total actions per day, while other customers may only use 10 pages, and both could be deemed equally 'healthy'.
For example, I am taking our pageviews and api calls and adding them all together, then comparing the previous week to the average of the past 10 weeks, ignoring missing data.
(System1 pageviews + System1 Sis1 api calls + System2 pageviews + System2 api calls) = combined usage number
Then, to calculate the score I tie it to this value and scale it -200 to 25, to account for swings in usage. Any increase in usage will lead to higher scores, while a decrease in usage will lead to neutral scores, provided there is some usage.

I'm looking for ideas on how to better score 'usage', as this isn't an ideal solution. Our highest usage customers are in the tens of millions of total actions per day, while other customers may only use 10 pages, and both could be deemed equally 'healthy'.
Reply

Sign up
If you ever had a profile with us, there's no need to create another one.
Don't worry if your email address has since changed, or you can't remember your login, just let us know at community@gainsight.com and we'll help you get started from where you left.
Else, please continue with the registration below.
Welcome to the Gainsight Community
Enter your username or e-mail address. We'll send you an e-mail with instructions to reset your password.