


Hi Everyone,
As we all know.. Retention analysis is one of the key parts in our PX analytics. Where we can see how much percentage of users retaining every Day/Week/Month. So Here, I would like to explain how retention analysis works (also with filters) in a bit detailed way.
Consider I’m going to calculate the retention of users “Every month for 6 months which is Ending at 06/30/2020 and metric is User Retention” when I use this criteria, my retention analysis looks like this,
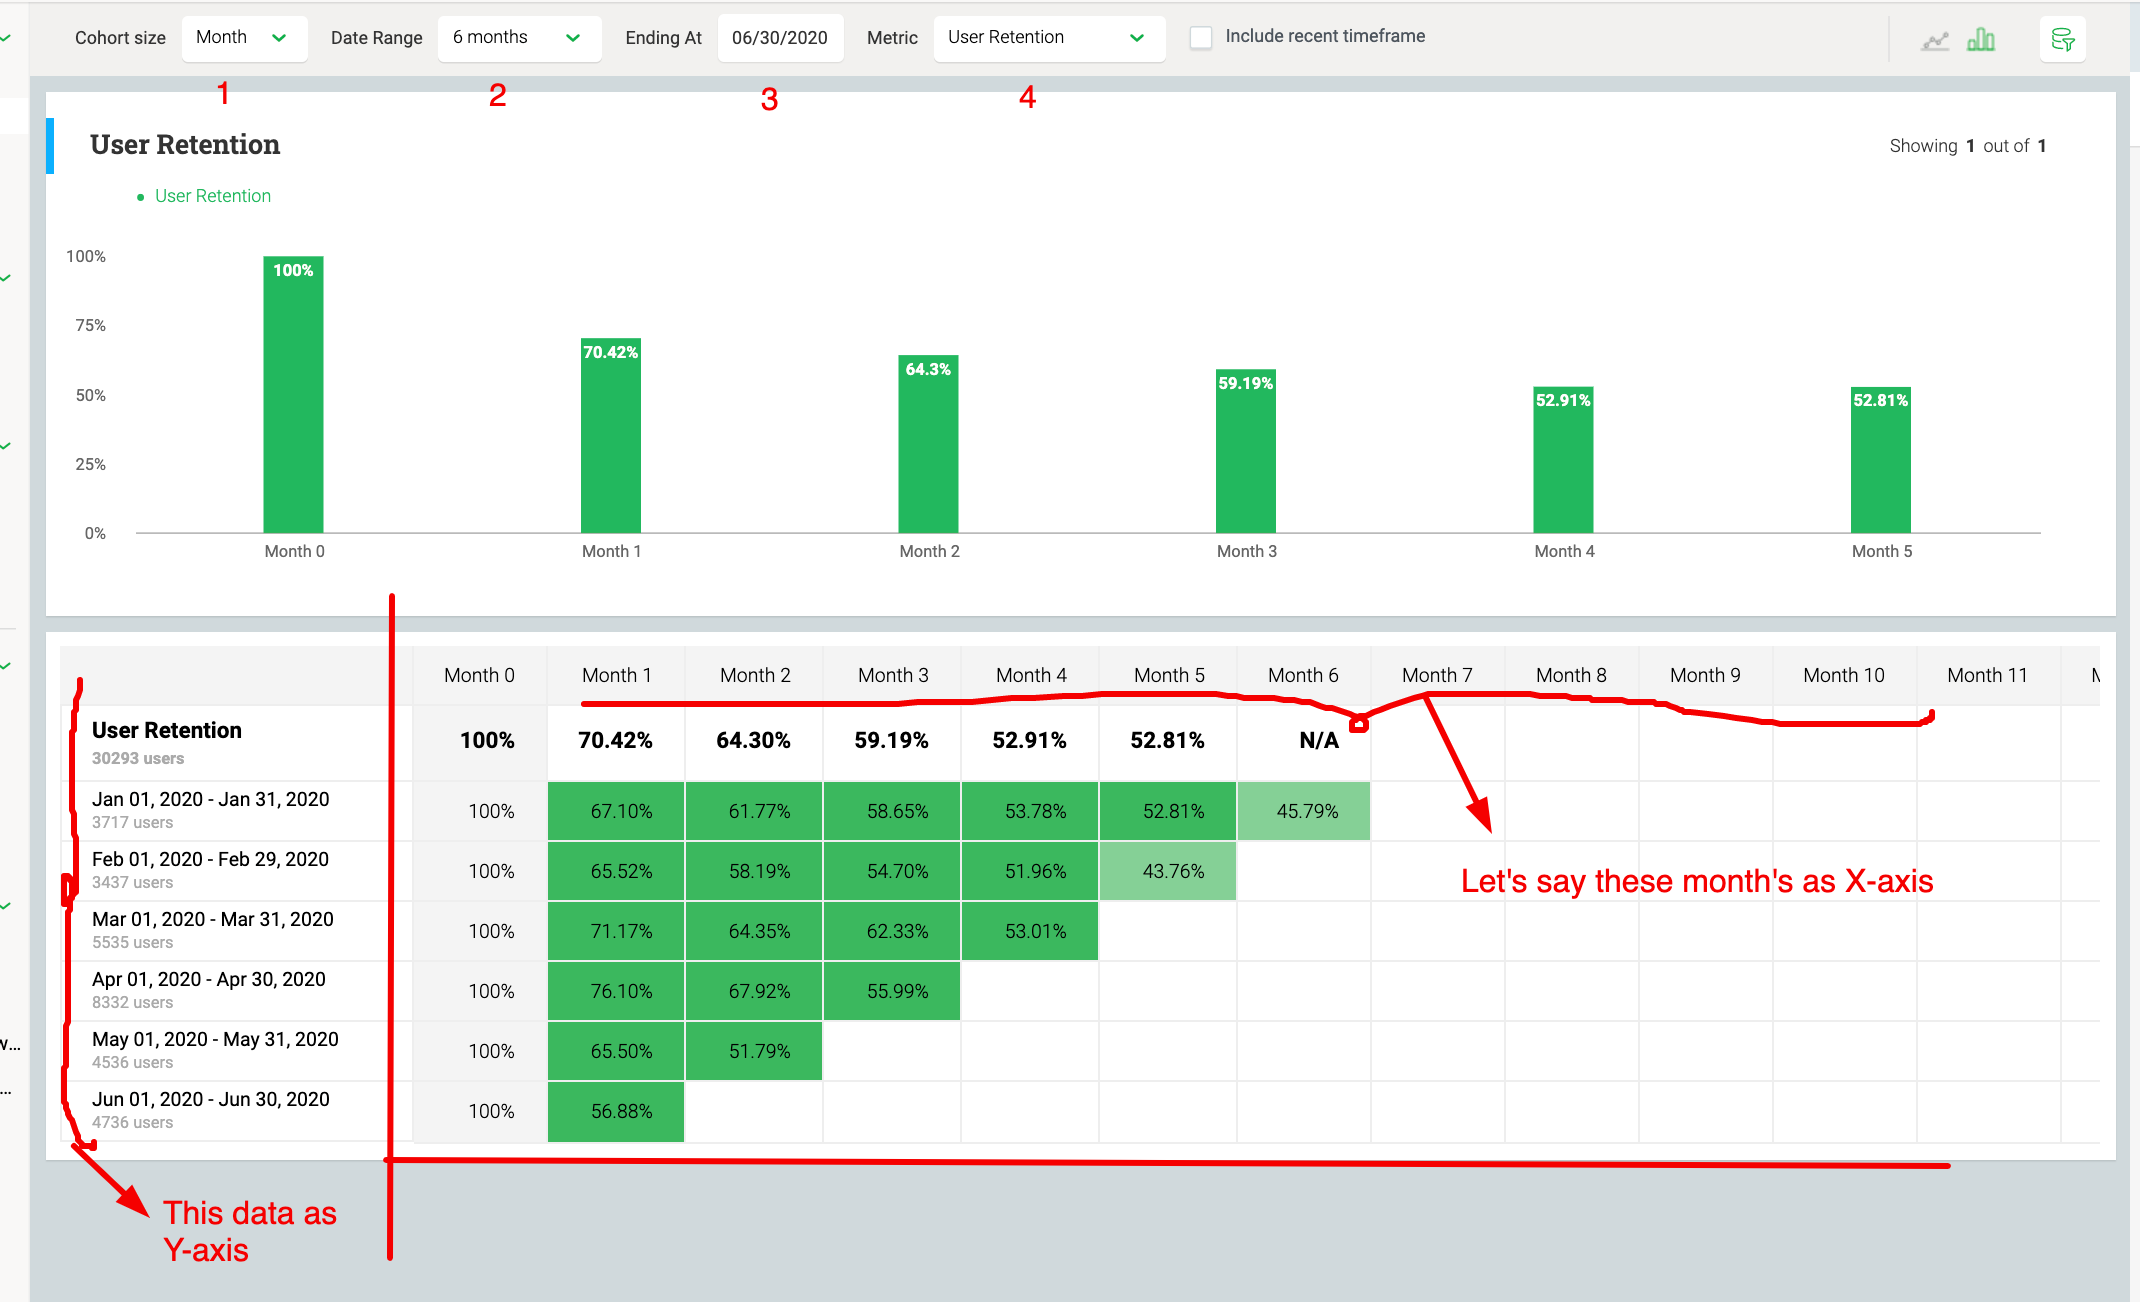
In the above image, I have indicated the Cohort size as 1, Date range as 2, Ending at as 3, And Metric as 4. And also, I have considered the “Month dates and User numbers which is on the left side as Y-Axis and the Month number which is from 0-12 as the X- Axis.”
So based on the 1, 2, 3 options, Y-axis has been divided into 6 slots. Now the Question is how the percentage is calculated in X-axis for every month?
Here, on the Y-Axis, along with the dates we can also see the User Count. These are the users who have first visited the WebApp in that particular time range. From the above image for Jan 01- Jan 31 2020, the user count is 3717.
On the X-Axis, this first month data will be considered as a reference to calculate the retention of users in other months. The Month 0 which you see in the image is nothing but the month which is parallel to it on Y- axis. Since I’m considering Jan 01, - Jan 31, 2020 as the example, my Month 0 will be Jan. That is the reason you see the Month 0 value as always 100%, unless you have 0 users in that particular month.
Now coming to Month 1, From the image You can see that for January slot the Month 1 percentage is 67.10%. This is the percentage of the users who have returned to the application in the next month among the users of reference month. Now that I’m in January slot, The next month for me is Feb. So According to the Cohort group, Among the 3717 users from Jan month, 67.10% of users have returned to my application in Feb.
Month 2- which is nothing but March, the graph shows 61.77%. This is nothing but among the 3717 users from Jan, 61.77% of users visited back my application. And for Month-3 (April), 58.65% of 3717 users visited my application again. Same continues to all the months of X- Axis satisfies the Date range which is nothing but Option 2 from the above image.
And for next slot in Y-Axis, which is Feb 01- Feb 29 2020, the base/ reference month will be Feb and Month 1 starts from March and calculation is same as above.
*NOTE: We have the ability to change the metric which is nothing but Option 4-- We do not always need to only look at User retention, If we drill down option 4, we have the options like Users, Accounts, Account Retention, Also Events.
RETENTION WITH FILTERS:
Now, Let’s see how Retention works after applying the filters.
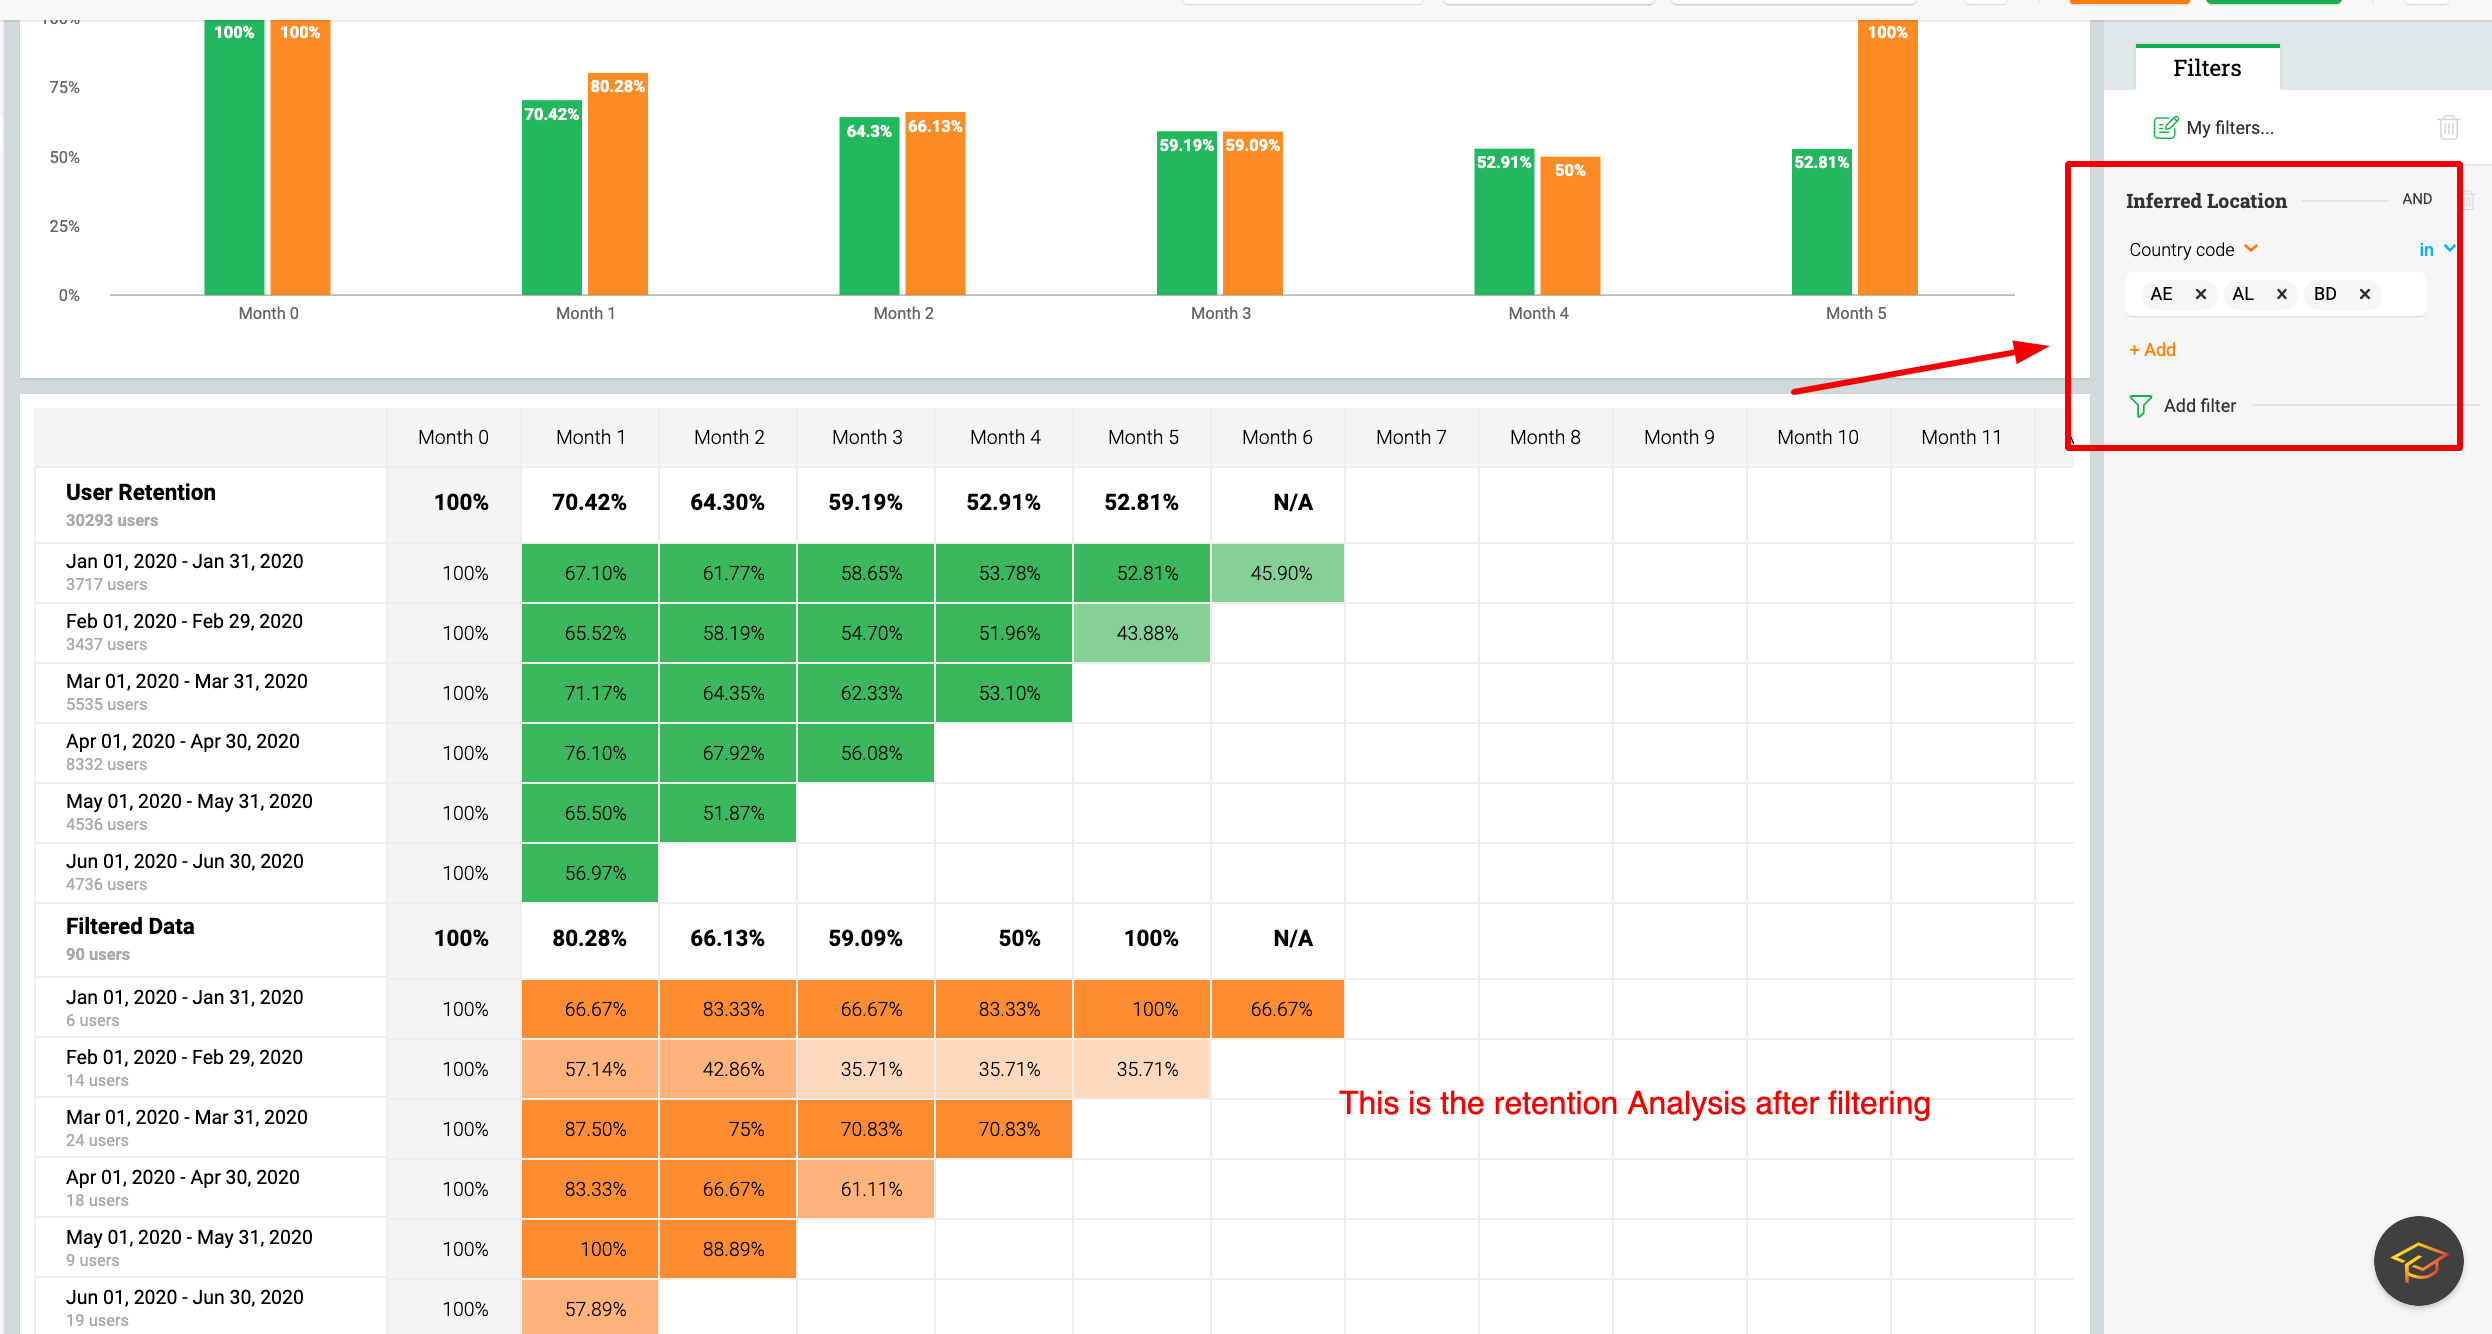
As per the above image, I have applied a filter of location by including some country codes. And as you can see in the Y-axis, Along with the months, Filtered Users will also be visible.
→ These users not the complete users whose country codes are according to the filter.
→ These are the users who have first visited the application AND also having country codes as in filter in particular time range.
e.g: For Jan 01-Jan 30 2020, we can see 6 users in the Filtered data. Among the 3717 users who have first visited the application in Jan, these are the users who are having Country codes as in filter.
And the filtered data for Month-1 will be Among 3717 first visit users, the users who have satisfied the filter criteria in that particular month which is FEB. According to the graph, it is 4 users for the month of Feb. And the rest of the process is similar for other months of X-axis as well as the Y-Axis.
TIPS:
- Even though if we choose Ending at a particular month/week which is nothing but Option 3 in the first image, it does not affect the X-Axis months and will only effect Y-Axis.
→X-Axis months will be affected by Option 2 which is nothing but Date range.
If we choose date range as last 7 days, For first day 7 days will be completed at the Ending date only. But from the second day onwards, X- Axis cannot END at the selected date as it has to satisfy Option 2. See the image below for clarification,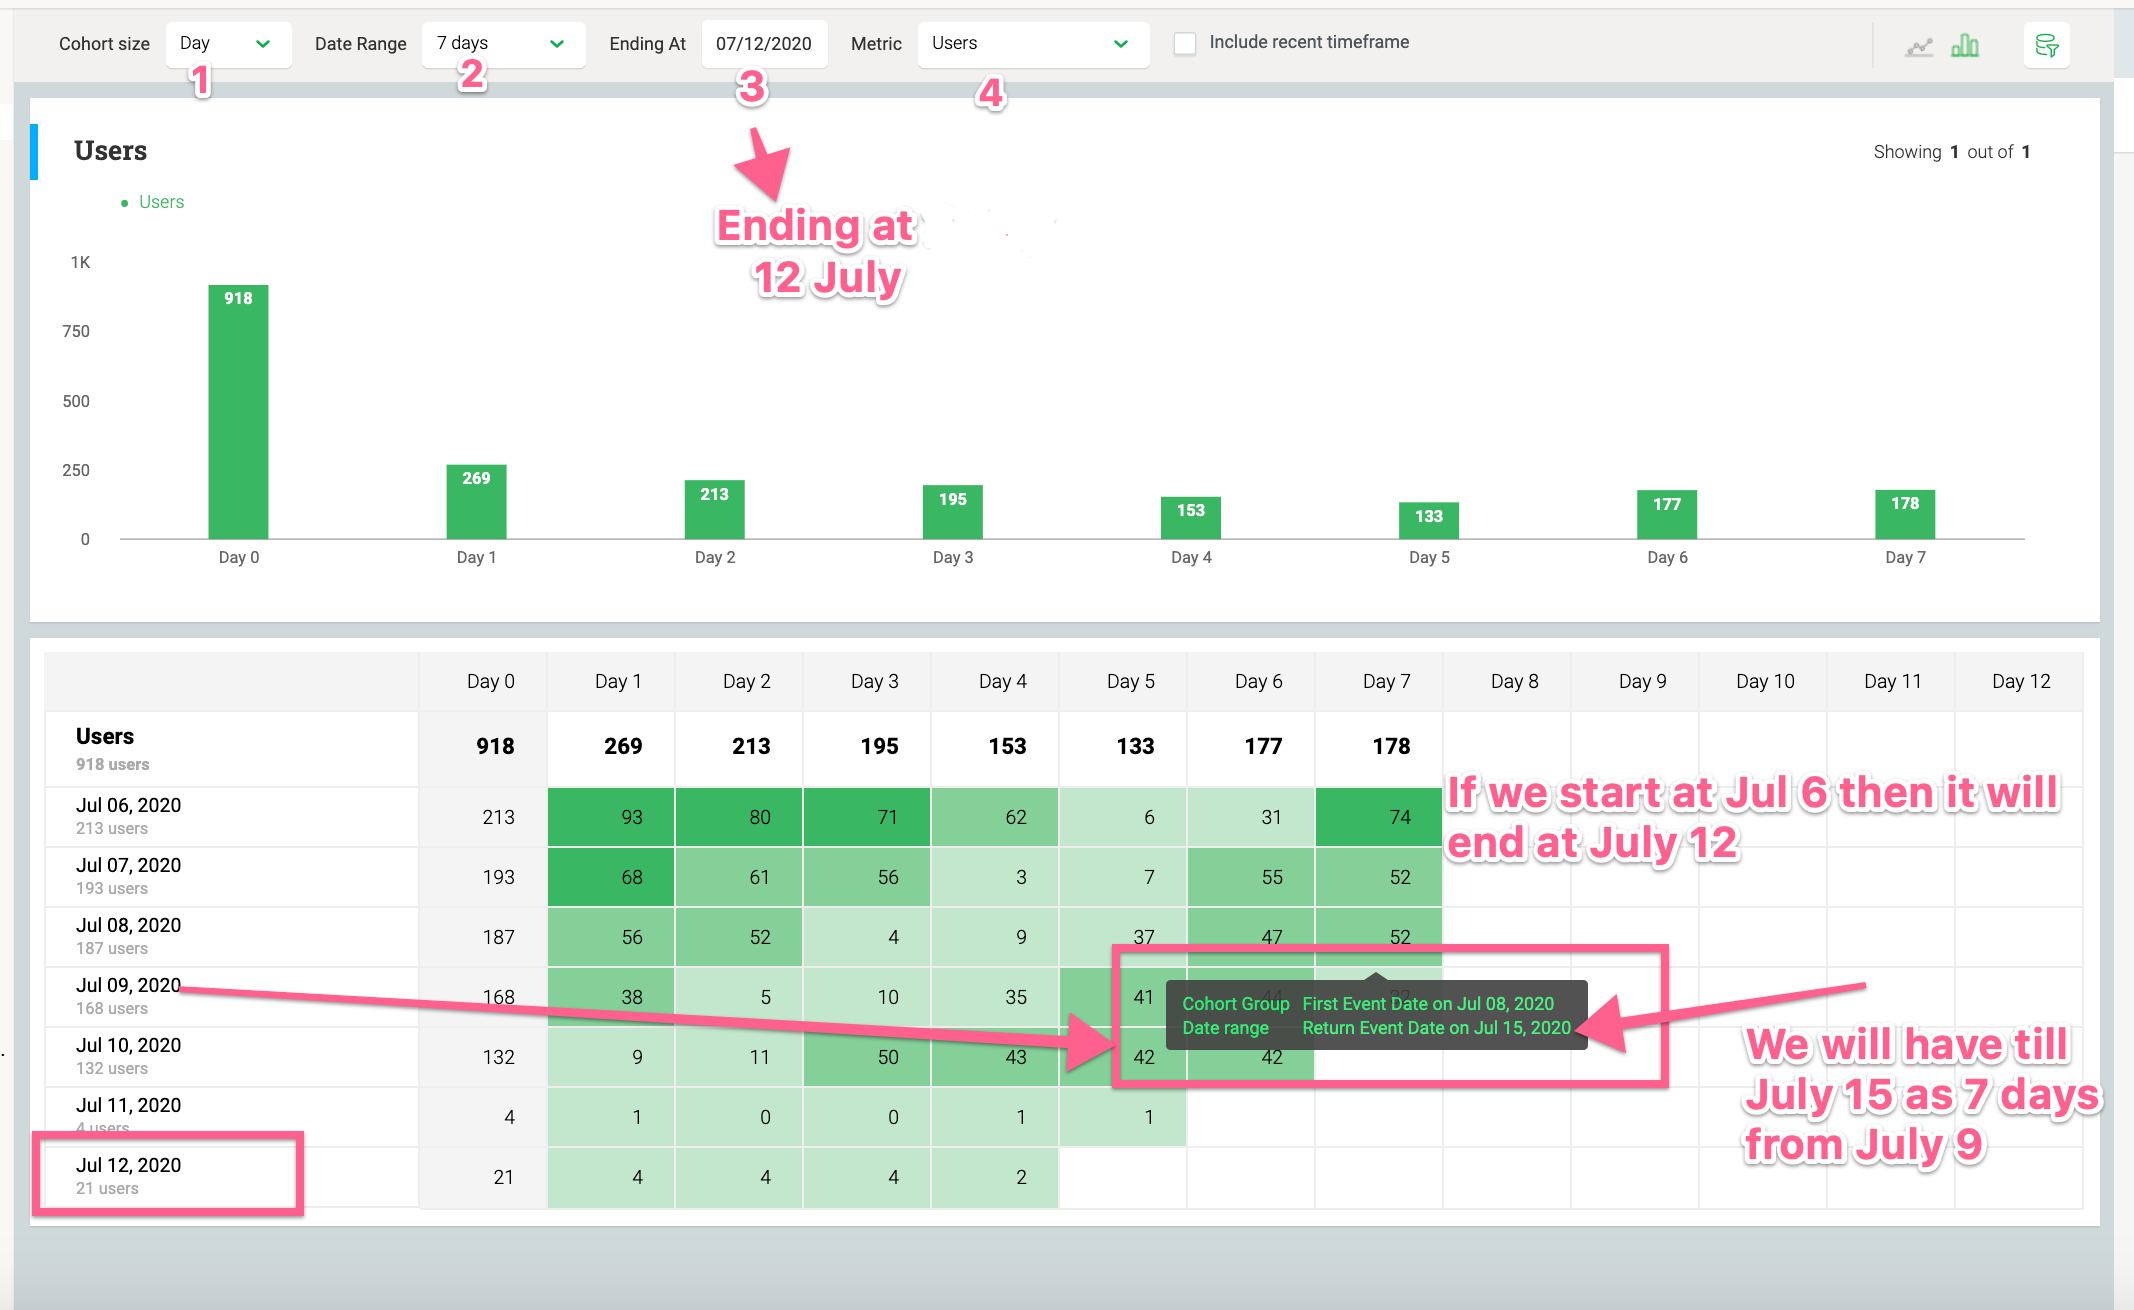
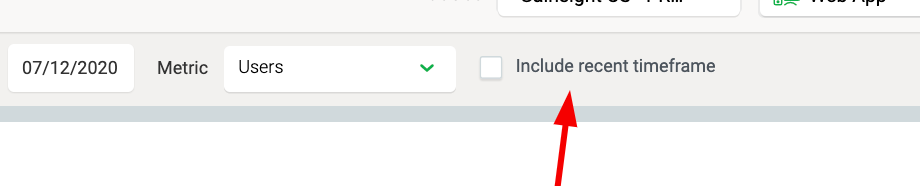
- Since the Ending date is not affected on X-Axis, We can even have today’s or This month or this week data as well which is not yet completed. And this data we can see in the Cohort group but no in the Retention Bar Graph or in the total retention, So If you want to see the incomplete data as well, Then we have a option called, Include Recent timeframe.
I hope this will be useful and improve the PX Experience ") Happy reading…!!!
Happy reading…!!!
Thanks,
Shireesha
