
Hi
I know how the Column Calculations work in Table format. But I am not sure how this option will work in the other visualizations types(Pie, Bar, Column, etc)
Screenshot: with Table format
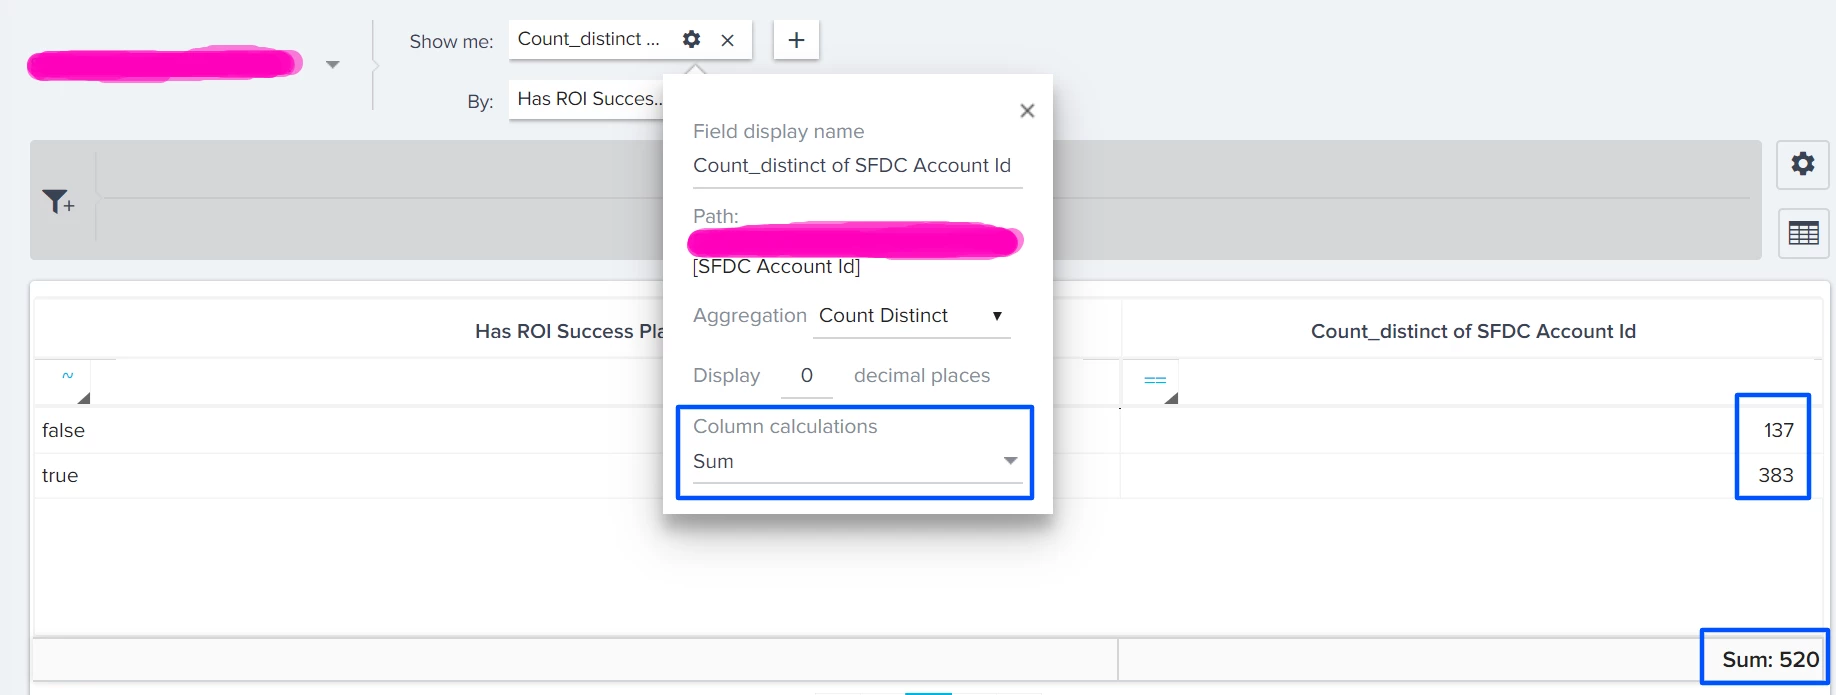
So here I used the “Sum” for Column calculations so at the bottom of the report we can see the
“Sum: 520”(137+383)
But if I changed the visualization type from Table to any other how this Option will work. And where I can see the Sum?
Screenshot: with Pie chart


Thanks,@sai_ram