
When I go to Reports 2.0, I need to be able to select at least 12 fields under Show Me, that I can display by Account Name or Number.
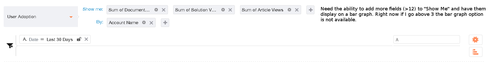
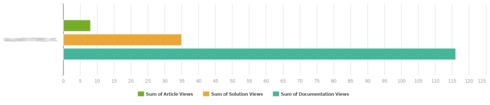
Right now I can only select up to 3 fields in order for the information to show on a bar graph.
If you ever had a profile with us, there's no need to create another one.
Don't worry if your email address has since changed, or you can't remember your login, just let us know at community@gainsight.com and we'll help you get started from where you left.
Else, please continue with the registration below.
Enter your E-mail address. We'll send you an e-mail with instructions to reset your password.

We've not implemented this capability because we don't have scrollbars in dashboards and report builder. As a result, we wont be able to display all fields in "show me" by account neatly without distortion.
Thanks!
The line graph does not work as well in a presentation as a bar graph.
We will be enabling stacked bar and column chart for > 4 items in "Show me". Tentative ETA is December release.
Thanks,
Sumesh
This feature will be available in Jan release.
Thanks!