Question

Strange Reporting issue: Numbers are not matching up

  • 27 July 2018
  • 2 replies
  • 21 views

Userlevel 3
Badge
Good Morning-


I’m working on some data validation for our dashboards and

noticed something funny. 


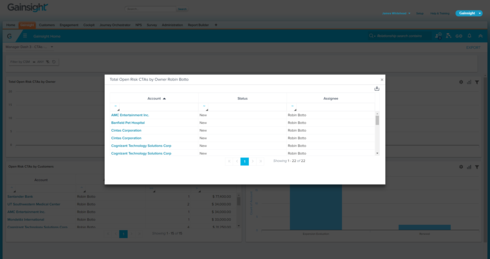
When I complete a search in Administration/Mass Edit, I

receive 22 results (seen below):


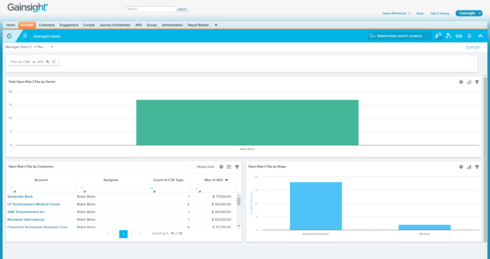
In the report I built to reflect this, I am showing 17 Risk

CTAs in the “Total Open Risk CTAs by Owner”:


When I click on that graph, I see all 22 Open Risk CTAs:


Here is the report logic:


Am I reading this

incorrectly?  With the way it’s built out

is the graph only showing the count of accounts that have risk CTAs, and then

when you click on the graph all the risk CTAs are populated?


 Thanks! 


-Jim

2 replies

Badge +3
I can't tell from your screenshot exactly what the Show field is but my hunch is that it is Account ID.  That would mean that you are counting the distinct accounts that have a CTA matching the criteria.  If you instead use CTA ID or something else unique per CTA then you will get the count you want.  Note that when you are joining objects together (as you do with Data Spaces and as we always do with Account and Customer Info) it can be easy to get the fields mixed up.  
Userlevel 7
Badge +1
Hi James, Hope @karl answered your question. Let us know if you have any further queries.


Thanks for posting 

Reply