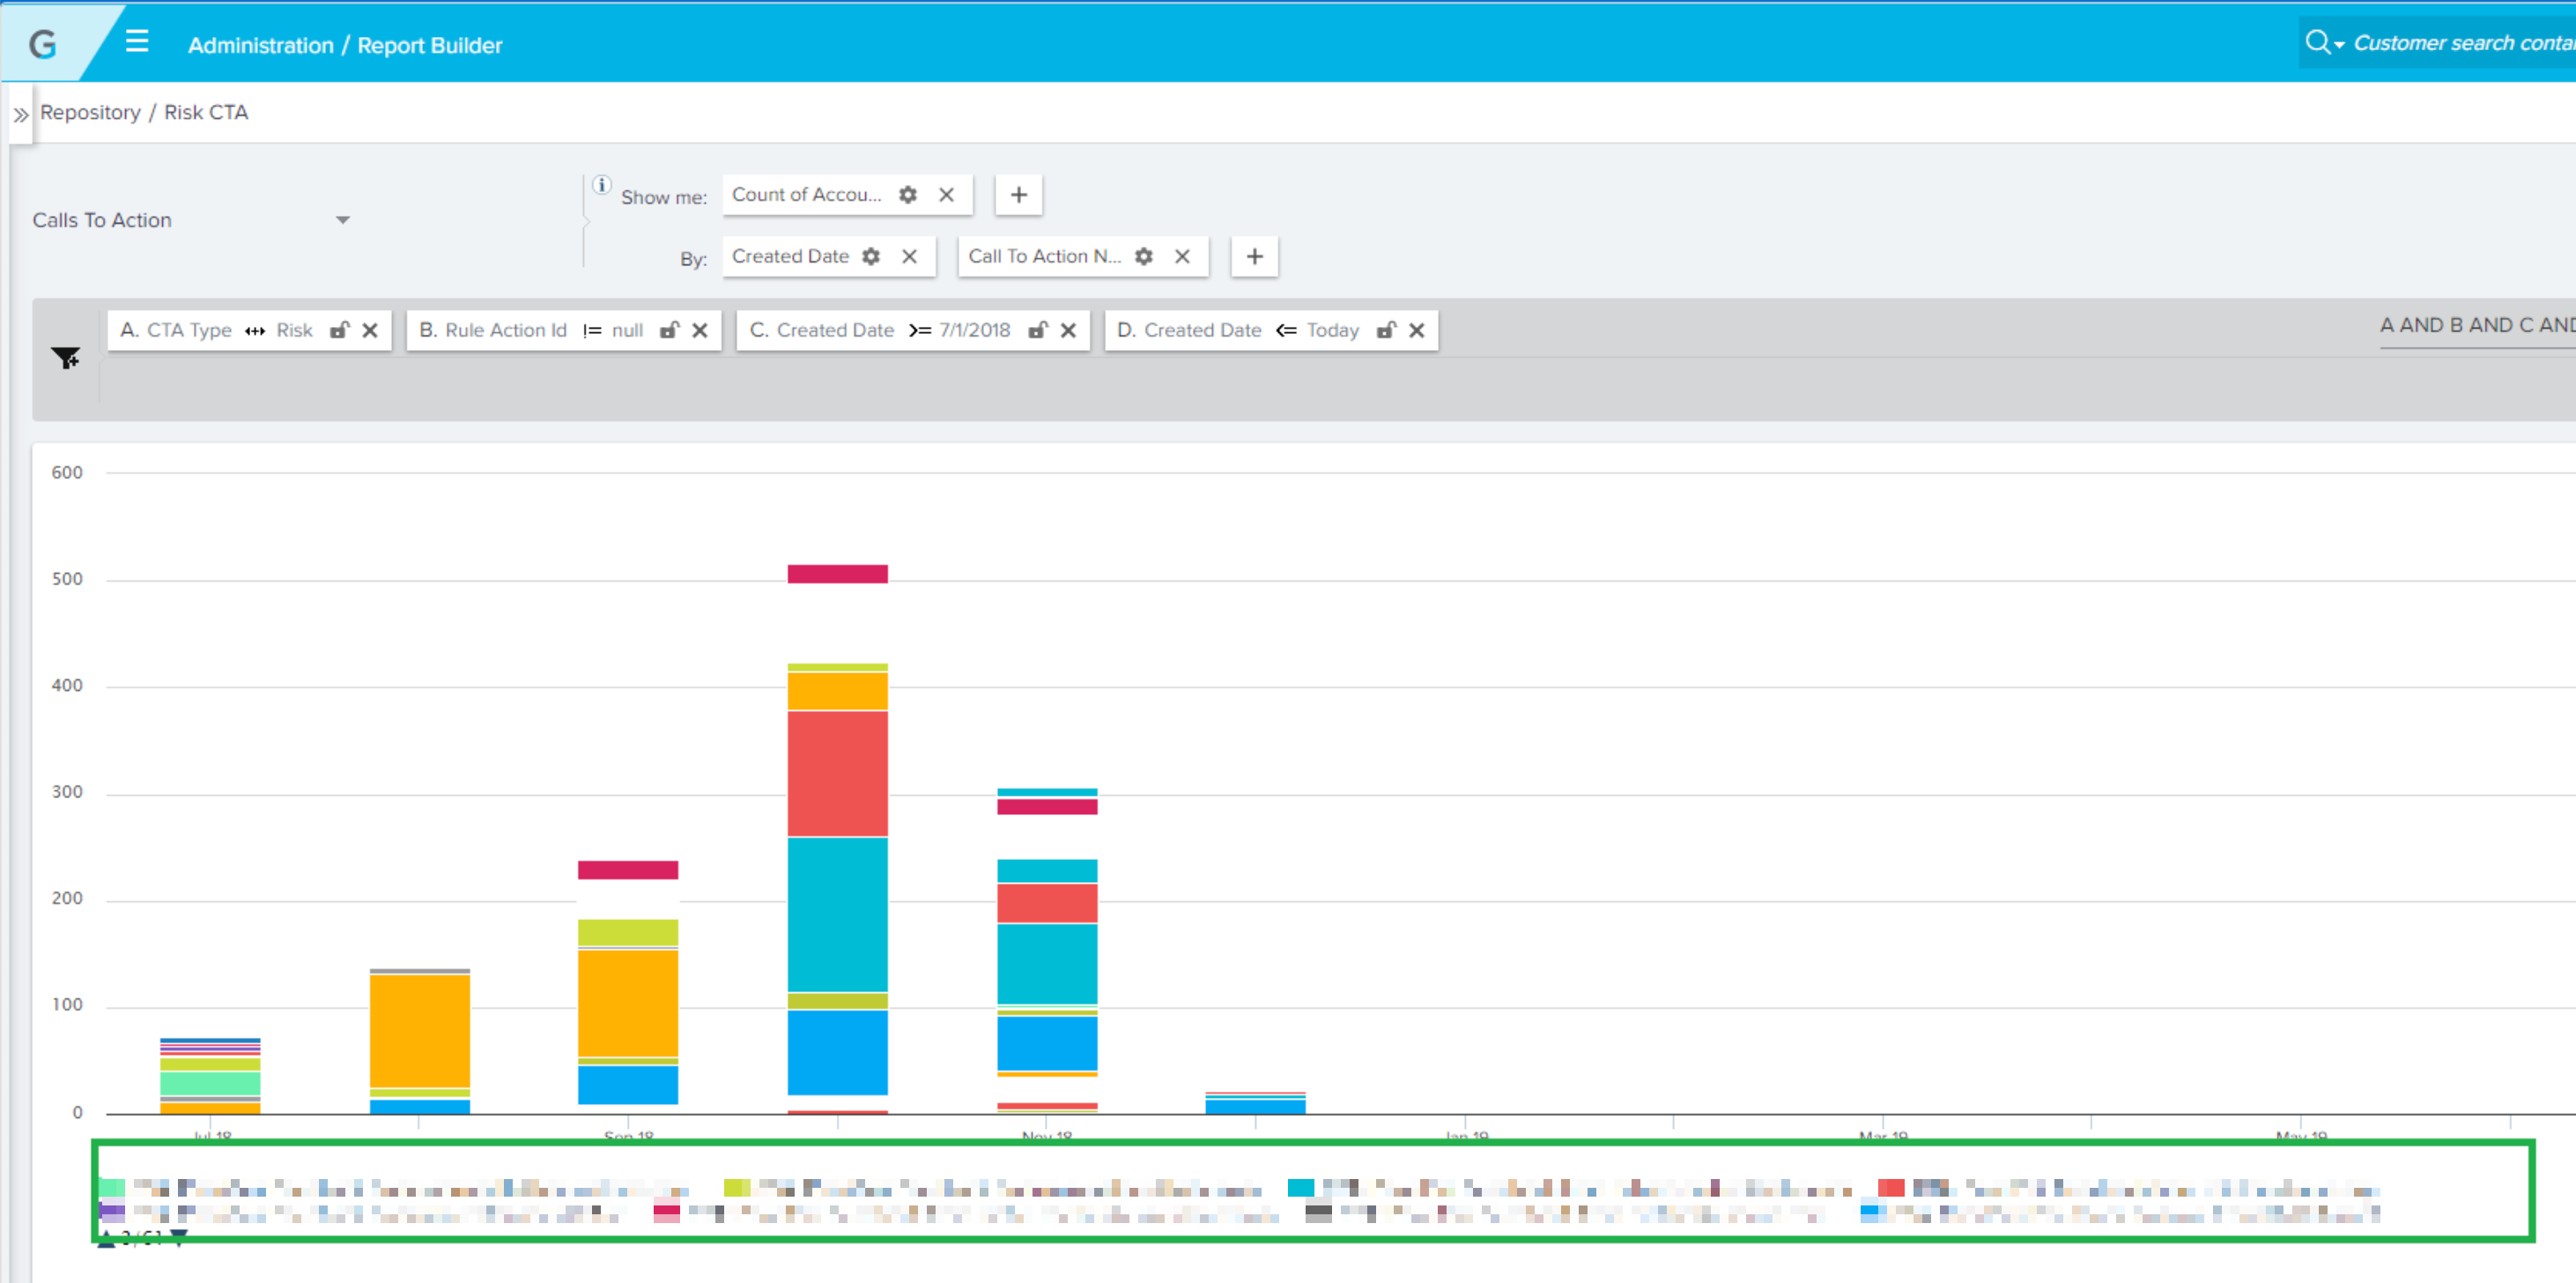
For instance, in this use case we are wanting to show all risk CTAs created by month, however a lot have similar names but tokens in the names so they show as different. We would like to be able to group those on the fly in reporting.
As a workaround we could make the reason the same but the work to do this would be a few hours to make sure the data is correct.
Another example would be:
- CTA Risk contact 1
- CTA Risk contact 2
- CTA Risk contact 3
- CTA Risk contact 4
- CTA Risk Risky
- CTA Risk contact 1
- CTA Risk contact 2
- CTA Risk contact 3
- CTA Risk contact 4
- CTA Risk (contacts)
- CTA Risk (contacts)
- CTA Risk Risky