
I need a single bar graph with 2 side-by-side measures, grouped by CSM.
The 2 measures are Count of CTA's opened, and Count of CTA's closed, within a time period.
I can figure out no way to do this other than creating a whole other "snapshot" table, with fields for "Total Opened" and "Total Closed". This would need triggers to keep it maintained in real-time. Those triggers alone would be a ton of work to implement, and I want to avoid that if possible.
Another option was to create a granular table with a separate record for each CTA Open and CTA closed event. This would be slightly easier to set up, but then I could only build the graph as a stacked bar graph, not a grouped side-by-side bar graph.
I can't be the first person to ever conceive of this report, and I figured there would have been some way to do it.
How to report on CTA's opened vs CTA's closed

Hi Brian:
I just built this report, and I think it would meet what you're trying to do. Feel free to take a look at it and let me know if so. You can see the source object as well as fields I used for it.
Thanks
Scott
I just built this report, and I think it would meet what you're trying to do. Feel free to take a look at it and let me know if so. You can see the source object as well as fields I used for it.

Thanks
Scott

Userlevel 7
 +2
+2
Hey Brian,
I started working on this one before I saw Scott's response. Scott is very fast!
Since it's not a duplicate, I'll post it anyway. A slightly different way to look at the data.
I started working on this one before I saw Scott's response. Scott is very fast!
Since it's not a duplicate, I'll post it anyway. A slightly different way to look at the data.

Hi Scott thanks for the response! That is also a good approach, but we're really looking for more of an Activity report, rather than a snapshot of how many CTA's are currently open and closed. I will pass this along though, I'm sure we can use something like this too.
Hi Dan, that looks like exactly what I'm trying to produce.
How did you create those two fields "Created CTAs" and "Closed CTAs"?
How did you create those two fields "Created CTAs" and "Closed CTAs"?
Userlevel 7
+2
Hi Brian,
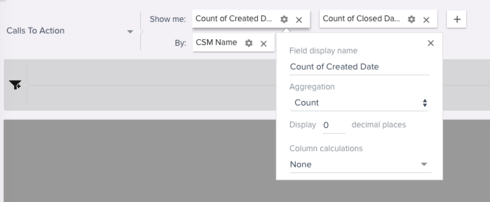
I just realized that when I changed the display names (to make the chart cleaner) it did change the data field and aggregation name.
Here is the way to do this (without the edits). The "show me" fields are Created Date and Closed Date and aggregation on Count.
I just realized that when I changed the display names (to make the chart cleaner) it did change the data field and aggregation name.
Here is the way to do this (without the edits). The "show me" fields are Created Date and Closed Date and aggregation on Count.
Oh cool, that's clever, I never thought of counting the Date values!
I was able to set it up like that, thanks a lot guys 🙂
I was able to set it up like that, thanks a lot guys 🙂

Very cool-- stealing this idea 😉 Thanks all!
I have a question in this matter as well:
As written in this thread we can use reports in order to track # of CTAs closed and opened.
Also, I know that we can track that Data by using the Usage MDA.
What are the advantages of using the MDA table instead of just create reports?
Thanks!
As written in this thread we can use reports in order to track # of CTAs closed and opened.
Also, I know that we can track that Data by using the Usage MDA.
What are the advantages of using the MDA table instead of just create reports?
Thanks!
Hi Scott, thank you for this. Question though, do we need a certain level of access or permission to create this? Say, do we need to be an admin or something?
You would need either access to the Gainsight Report Builder (which is housed in the Administration tab, however it can be exposed outside of that tab) or to the general Administration tab.
Reply

Sign up
If you ever had a profile with us, there's no need to create another one.
Don't worry if your email address has since changed, or you can't remember your login, just let us know at community@gainsight.com and we'll help you get started from where you left.
Else, please continue with the registration below.
Welcome to the Gainsight Community
Enter your username or e-mail address. We'll send you an e-mail with instructions to reset your password.