

Last year (which feels like a decade ago), Alex wrote this lovely piece: Measuring How Engagements Impact Feature Adoption
I want to expand on that and show you how you can create a centralized view in a Custom Dashboard as well. This can be useful for measuring the impact of:
- product release engagements on initial feature adoption
- user guides on feature adoption over time
1 - Create a Custom Dashboard
2 - Add 2 widgets
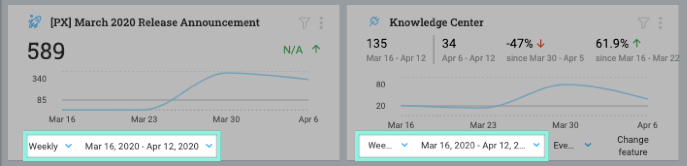
- Engagement Widget - Dialog, Guide, or Slider
- Feature Performance Widget - Select the Feature or Module for which you’re measuring adoption
3 - Set the time ranges on each widget
- For product release engagements: Set the time range to start a few days prior and extend a few weeks past the product release
- For user guides: To start, you can set the time range to match how long the guide has been out, up until a few weeks prior to give yourself a baseline.
4 - Apply Filter to Feature Performance Widget
In the Feature Performance Widget, click the Filter icon and apply the following filters:
- Guide/Slider/Dialog
- Select the engagement that you are measuring
- Interaction = Completed (For Dialog, select “Viewed”)
5 - Duplicate Feature Performance Widget
Click the vertical ellipsis in the upper right corner and Clone.
6 - Modify Logic in Cloned Feature Performance Widget
Change the logic:
- Interaction is completed » Interaction is not completed
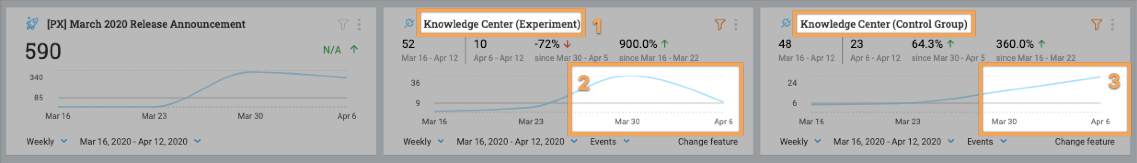
7 - Evaluate Your Data!
Also note that the middle widget and the right widget are not on the same scale.
- Make sure to rename the widgets to indicate the experiment and control group.
- In this example, I observed that the spike in activity for the feature happened close to the release date for users who completed the release engagement.
- For users who did not complete the release engagement, their feature activity increased eventually but it took longer to increase.
A conclusion you could make from this example is that new feature adoption increased more quickly for users who completed the release engagement. For those who didn’t complete the engagement, their adoption eventually increased but it took more time.
Bonus: You can build in a control group in your engagements, that way your analysis can be even more precise. Learn how in this doc.


