News

Q1 2022 Release - Reporting Improvements !

Q1 2022 Release - Reporting Improvements !
Badge

 Hey Everyone, 

With the Q1 2022 - We are fixing and improving a number of minor features and I am really excited to bring these minor but impactful changes to you ! ( Quick 3 min video of all the changes - watch at 1.5x speed).  

  1. EXPAND ALL / COLLAPSE ALL option is now available for Row Grouped reports (you can enable this via the settings icon on report builder screen→ grid options)  

     
  2. Gauge widgets with group by also support Drill down customization.(modifying the drill down in any one gauge carries over to other gauges as well) . 


  3. The KPI widgets can now display a longer length of the headline text, the Refresh and Three dot menu will be hidden away till you hover over the KPI Widget. 


  4. Heatmap Summarization is now supported ! 


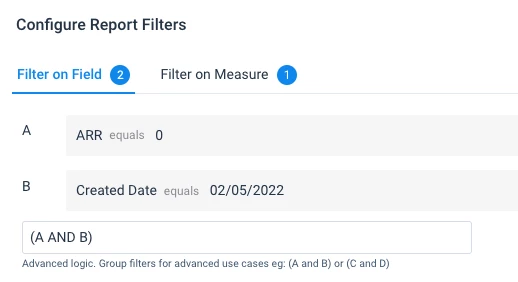
  1. We have made small but impactful changes to configure filters in your reports ! 
  • Emails fields can now be searched by entering email id’s as well as names. 


  • ID values are now searchable with equals filter across number and id types 
  • Filtering for a custom date  or entering the number “0” will display the right values instead of “any”. 


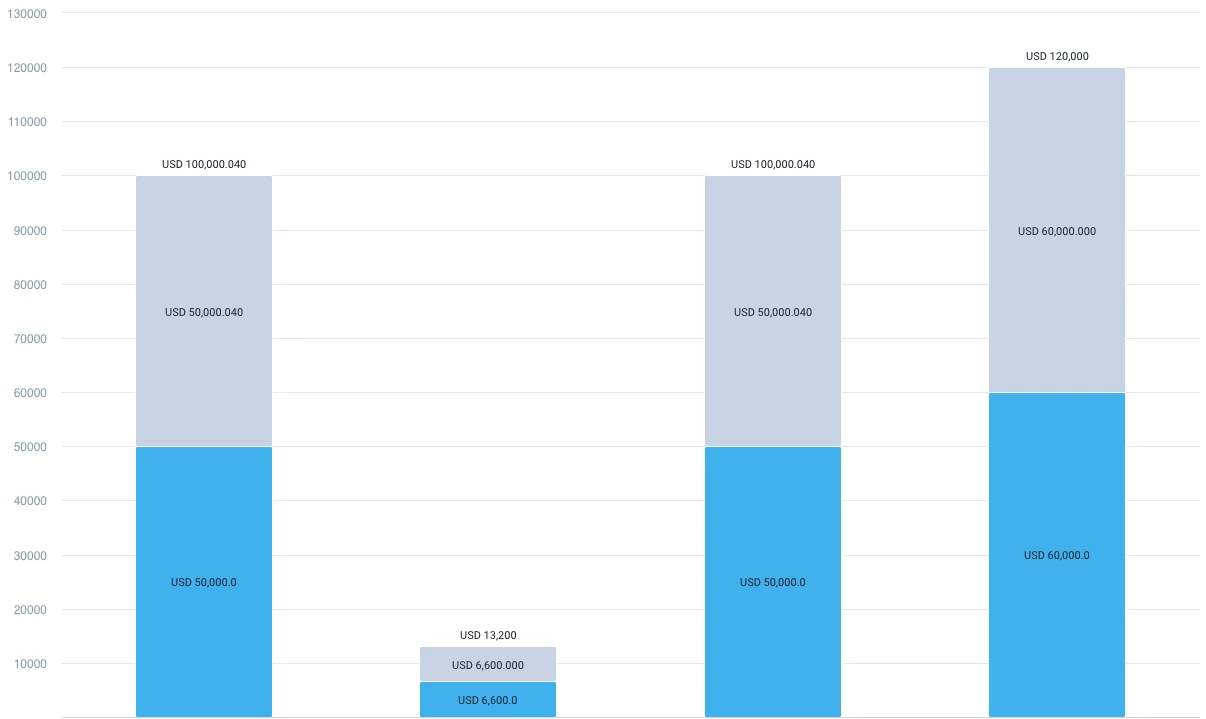
  1. Improvements to the Stacked Bar chart visualization
    • Currency code is now available on the total value as well.  
    •  


3 replies

Userlevel 6
Badge +8

@Azad Congratulations on rolling out so many meaningful improvements! We have already benefited from many of these enhancements. Very exciting to see these changes.


One that I would love to call attention to and get your thoughts on is the Expand All / Collapse All. 

Could you review my community post and provide your thoughts? Perhaps I’m not understanding the functionality correctly, but it appears that with reports with large datasets, it limits the number of records returned when this feature is enabled, making this unusable for reports used in dashboards that rely on global filters to filter the data, or reports used in related lists on C360 that filter based on the company ID.

Userlevel 7
Badge +6

@Azad honestly not sure when this came out but I just noticed it, so if it came out on this release you missed it in your update :)


  • The ability to configure a drill down on a visualization if there is no data in your report (yet!) which solves this request 

    @heather_hansen FYI

edit: Only true for some visualizations so it’s possible I spoke too soon

Badge

@Azad honestly not sure when this came out but I just noticed it, so if it came out on this release you missed it in your update :)


  • The ability to configure a drill down on a visualization if there is no data in your report (yet!) which solves this request 

    @heather_hansen FYI

edit: Only true for some visualizations so it’s possible I spoke too soon


As discussed in Slack as well ONLY KPI and Gauge widgets with a aggregation of Count and Count distinct shows 0 - since a count of nothing is zero “0”  but a sum, avg, min or max of nothing is null. 
We will be working on designs to allow drill down configuration without data in the medium term. 

Reply