Solved

Scorecard Status Counting/Suming


Hi Community! Hoping someone has a creative solution to a problem we've been trying to solve for months.


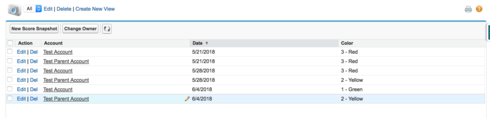
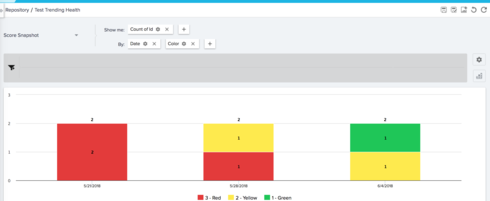
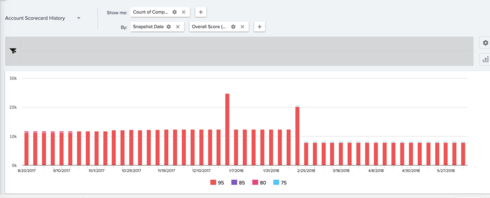
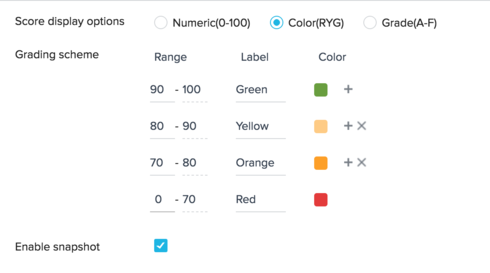
We have an overall account health rating/scorecard that writes the score (red, yellow, or green) to a salesforce object once a week. I've been able to make a GS report that shows accounts that have been red for over 60 days by looking for the occurrence of a red score for 8+ weeks in a row. However, we really need a trend report to see how many red accounts we have week-to-week. I've tried what feels like every possible combination of SUM and COUNT fields, but I can't figure out how to 1) get the sum of red accounts for a week and 2) store it so we can have trend reporting (I want a trend line in a dashboard, ultimately). Any thoughts? I'm willing to rebuild a lot of this if needed, so any ideas are helpful! 
icon

Best answer by rbegley 8 June 2018, 16:08

View original

10 replies

Badge
Allison,


What is the structure of your Salesforce object you are loading the scores too?


With a Salesforce or MDA object that has fields for Account, Date, and Color, you should be able to create a report that counts the number of Accounts in each Color, trending over time.


Below shows two test Accounts having snapshots for 3 weeks:


Here is a report off of that object doing a COUNT of Salesforce ID grouped by Date and Color:


Hopefully this helps your approach.
Badge
You can add a filter in here for Color = Red to show the count of Red Accounts only week over week (and remove the Color field from By if you are only showing one).
Hi Allison,


Are you using Scorecard 2.0? If so..you should be able to create a report on the History object to create the report (WoW trend of customers by health score). This document has more details on how to create the report.

Let me know if this helps  
Badge
Aditya,


My experience with the Scorecard History object is that it only snapshots the number value (even if you are on a color scoring scheme) and so the report you show in your document doesn't visually look like that when you apply those report settings.  When on a RYG system, it will snapshot the midpoint of the range.


Notice 95, 85, 80, 75 correlate directly to the midpoint of the ranges defined below:


For showing counts of one color, this object works well as long as you know the midpoint of the scores you are trying to show (I.E. Count Company ID By Snapshot Date, filter Overall Score = 75), but if you group by Overall Score, you will get number buckets. 


If you are on a number based system, there will be one bucket for every number, instead of just the scoring "buckets" that you have defined.  Am I missing something?
Thanks for so many replies. We're on Scorecards v1 currently, and since it's in my backlog to migrate to V2, I've started that process. Hopefully this helps me a bit.


Rob, what you mention is what I keep running into; I can't sum or bucket the ratings in any meaningful way, nor can I get a snapshot of that total (if I were able to get it, that is) for trend reporting.
Badge
Is your object similar to mine? If one row in the object is the score for that Account for that time period, you should just be able to COUNT them by Date and filter the Red only.  If you want to send some screenshots or more information about your report / object specifically I could offer more guidance.
Rob, with a little tweaking of the fields on my end, COUNT of the ID worked! We've been trying to figure this out for so long, so thanks for a very clear (and easy) solution.
Badge
You are very welcome, so glad its working now!
Hi Rob,


If you add a filter of "Scorecard Name", then it picks up the scheme defn to render the report correctly. Something like this


Does that help?
Badge
That is incredibly helpful, thank you!


Is there a way to get them to order correctly (i.e Red, Orange, Yellow, Lime, Green) from lowest scores at the bottom to highest scores at the top? 


I have accomplished this in custom objects by leading the values with a number.

Reply