Question

Confusion regarding Account Retention Analysis

  • 9 October 2022
  • 3 replies
  • 71 views

Userlevel 2

Hi, I would like to make use of retention analysis, specifically to measure “Account Retention”, but I have a few questions regarding it from a technical perspective. 

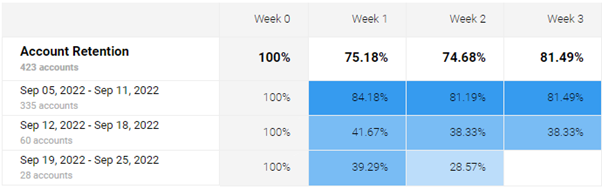
I’ll use the following image as a reference for my questions 


  1. How does GPX calculate the number of accounts that I can see on the Y-axis (335/60/28)?

    Let’s take the cohort of Sep 05, 2022 – Sep 11, 2022

    Here, it mentions the number of 335 accounts. What I want to know here is:

    a. Are these accounts that had their first lifetime visit on the web app?
    b. Are these accounts that had their first web app visit during this specific period?
    c. Are these accounts that were created on this particular day into Gainsight’s database? (Although I’m pretty sure this isn’t the case)

    Also, please let me know about what account variables (if any) are involved in calculating this number. If possible, could you also explain this for measuring user retention? Mainly what user variables are involved in calculating that number and what it means.
     
  2. How are the numbers in the first row calculated? The total number of 423 is explainable by adding the numbers underneath. I’d like to know how the percentages are calculated.
     

It’d be very helpful if someone could assist me in answering these queries as I have a few follow up questions. I look forward to your reply! :) 


3 replies

Userlevel 5
Badge +1

Hi @Simarpreet Singh 


Appreciate you reaching out on the community! Please review the below explanation and let us know if this is helpful! We also recommend you to do reach us on pxsupport@gainsight.com

Referring to the above image you have shared and considering the the cohort period of Sep 05, 2022 – Sep 11, 2022

Short Video: Retention Analysis Video


There are 335 unique new accounts identified between 5th & 11th Sept.
Example: 

  • Assume I have 10 users from A1 (A1 Created on 10th Aug)
  • 50 users from A2 (A2 Created on 19th Aug)
  • 30 users from A3 (A3 Created 6th Sept)
  • 15 users from A3 ( these 15 new users logged in on 8th Sept, but A3 Created on 6th Sept)
  • 25 users from A4 (A4 Created 10th Sept)
    • From this example there will be 2 Accounts count will shown up in the Y-Axis for the cohort range of Sep 05, 2022 – Sep 11, 2022


Are these accounts that had their first web app visit during this specific period? - Yes

Are these accounts that were created on this particular day into Gainsight’s database? (Although I’m pretty sure this isn’t the case) - When you say created on gainsight database, an identify call happens on your end application  for a user with an association to the account, if the account already exists/created it will not create a new one, however, if users sign in with a new account association that was never created in PX, it will create an account and will be considered for the respective date range cohort on Y-Axis.

Short Video: Retention Analysis Video


How are the numbers in the first row calculated? The total number of 423 is explainable by adding the numbers underneath. I’d like to know how the percentages are calculated.


Taking: cohort range of Sep 05, 2022 – Sep 11, 2022 - 335 Accounts

  • For these 335 Accounts the week 0 would be the same week that they are identified so, it would be 100%
  • For these 335 Accounts the week 1 would be next week of the cohort range ( Sept 12th to Sept 18th) so 84.18% of 335 = 282 Accounts came back to the system. 
  • For these 335 Accounts the week 2 would be next week of the cohort range ( Sept 19th to Sept 25th) so 81.19% of 335 = 272 Accounts came back to the system. 
    • In this 272, Accounts there could also be accounts who came in Week 1


Hope this helps!


Again thanks for reaching us on community and do feel free to reach our awesome PX support team on pxsupport@gainsight.com


Thanks

Dileep Nalla


Userlevel 2

I really appreciate your reply Dileep, especially with the informative video. However, I have a few questions as I’m still unclear about certain things. I’ll mention them here, but please let me know if I should send it to pxsupport instead and I’ll do that. 


Question 1

  1. Let’s say that a user signed up and Account A1 was created on Sep 6th, 2022. If I refer the same image as I’ve posted above, according to the retention analysis, that account will be counted in the 335 accounts. However, what if my cohort starts from Sep 12 - Sep 18 instead of Sep 05 - Sep 11. If A1 was active during this period, will it be counted in this cohort? 
  1. Alternatively, if a user signed up on Aug 02, 2022 with account A2, and this user didn’t visit our web app again until Sep 15, 2022. Will they be a part of the 60 accounts as seen above or will they be excluded from this report?

What I really mean to ask is, does GPX measure the first lifetime visit or the first visit during the specified time period


Question 2

When I mentioned the first row, I actually meant the row with Account Retention written there with the numbers 100% - 75.18% - 74.68% - 81.49%. Could you tell me how that is calculated?


My Use Case

I want to know how account retention works because of the following scenario. Let’s assume that:

  1. GPX was installed on October 10th, 2022. 
  2. Account A3 has signed up on the platform on January 1st, 2022, before GPX was installed.

When the identify call is made, the account will be first shown as active on October 10th, 2022, but I don’t want that. I want it to shown as active on January 1st, 2022 even though I’m well aware I can’t measure its retention from then on until October 10th, 2022 because GPX wasn’t installed.

My sole use case is to not spoil data collection for newer accounts. If I have 500 existing accounts who may have originally signed up on any date before October 10th, 2022, and they log in throughout October, GPX will falsely attribute their signup date and show them in October cohorts. This means that I can’t correctly isolate new account signups and analyze their retention properly. 


Is their any account attribute I can update via an API call that will help map the actual first visit/creation date of the account? (This is a date we have in our DB)

Userlevel 5
Badge +1
  1. Let’s say that a user signed up and Account A1 was created on Sep 6th, 2022. If I refer the same image as I’ve posted above, according to the retention analysis, that account will be counted in the 335 accounts. However, what if my cohort starts from Sep 12 - Sep 18 instead of Sep 05 - Sep 11. If A1 was active during this period, will it be counted in this cohort?  ---- No, if Account A1 is part of Sep 6th Cohort & will not be part of other Cohorts. 
     
  2. Alternatively, if a user signed up on Aug 02, 2022 with account A2, and this user didn’t visit our web app again until Sep 15, 2022. Will they be a part of the 60 accounts as seen above or will they be excluded from this report? ---

    There are two types Accounts Retention & User Retention.

    If the user is signed up on Aug -02-2022, with account A2, the user will be part of Aug-02nd user retention cohort, and if the user didn’t come back to the web app again, you will see drop in user retention % of week over week calculation (horizontal axis), and when user coming back on sept 15th-2022 you will see raise at the approx. 6th week of retention % of week over week calculation ( horizontal axis) of the Aug- 02nd cohort

    When coming to account retention analysis, if account A2 is created upon new user sign up on Aug 2nd, then this account will be part of Aug 2nd cohort, however if none of the users associated to the account come back to web app, there will be drop in the account retention % of week over week calculation ( horizontal axis)& when any user associated to the account comes back on sept 15th, raise at the approx. 6th week account retention % of week over week calculation ( horizontal axis) of the Aug-02nd cohort.


What I really mean to ask is, does GPX measure the first lifetime visit or the first visit during the specified time period. - First Life time visit will be considered on the Y-Axis and visits during the specific time period will be considered on the x-axis % of week over week calculation ( horizontal axis) of the Same Cohort Range.


Question 2: When I mentioned the first row, I actually meant the row with Account Retention written there with the numbers 100% - 75.18% - 74.68% - 81.49%. Could you tell me how that is calculated?

Answer: Please click this link WoW overall calculation explanation 


 Use case: Please watch this video recording: Use case Video Recording - Click Here


Thanks

Dileep Nalla

Reply