
Context: One of our Strategic Partnership Managers (this role is similar to an Account Manager type for a large, high-touch customer) was prepping for the QBR with one of her accounts this morning. We worked together to find some GPX data to facilitate the conversation.
I took the approach of having my colleague ask me the questions she was trying to answer, then we explored GPX to answer those questions.
Questions:
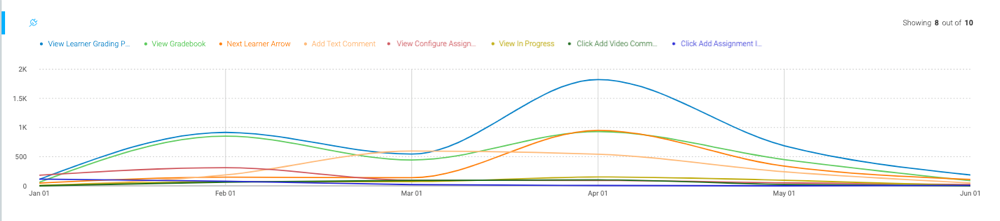
- 1: The last 2 quarters, what paths did this partner's users take in our product?
- PX Feature: Path Analyzer
- Filters: [list]
- Account Filter > Integration Type is [partner name] (this is a custom attibrute in GPX for us, could be filtered to account name)
- Date Range for the Path Analyzer:
- 1 report set to 1/1/19-3/31/19
- 1 report set to 4/1/19-6/30/19
- Sidenote: It would be nice to be able to see Path Analyzer data for more than 3ish months at a time.
- Scope = User
- PX Feature: Path Analyzer
- Filters:
- Account Filter > Integration Type is [partner name] (this is a custom attibrute in GPX for us)
- Users Filter > Signed Up: [list]
- Between 1/1/19 - 3/31/19
- Between 4/1/19-6/30/19
- 1 report set to 1/1/19-3/31/19
- 1 report set to 4/1/19-6/30/19
- Date range at the top of the Path Analyzer = time filter for the activity displayed in the report
- Date range within the user signup filter = time filter for the users who signed up during that timeframe
- Therefore, by applying a signup time filter with the same activity time filter, I am asking the question:
- For users who signed up this quarter, what are the paths they took in our product this quarter?
- If I applied a signup filter for users who signed up in Q1 2019 with an activity filter for Q2 2019, I am asking the question:
- For users who signed up last quarter, what are the paths they took after being in our product for a few months?
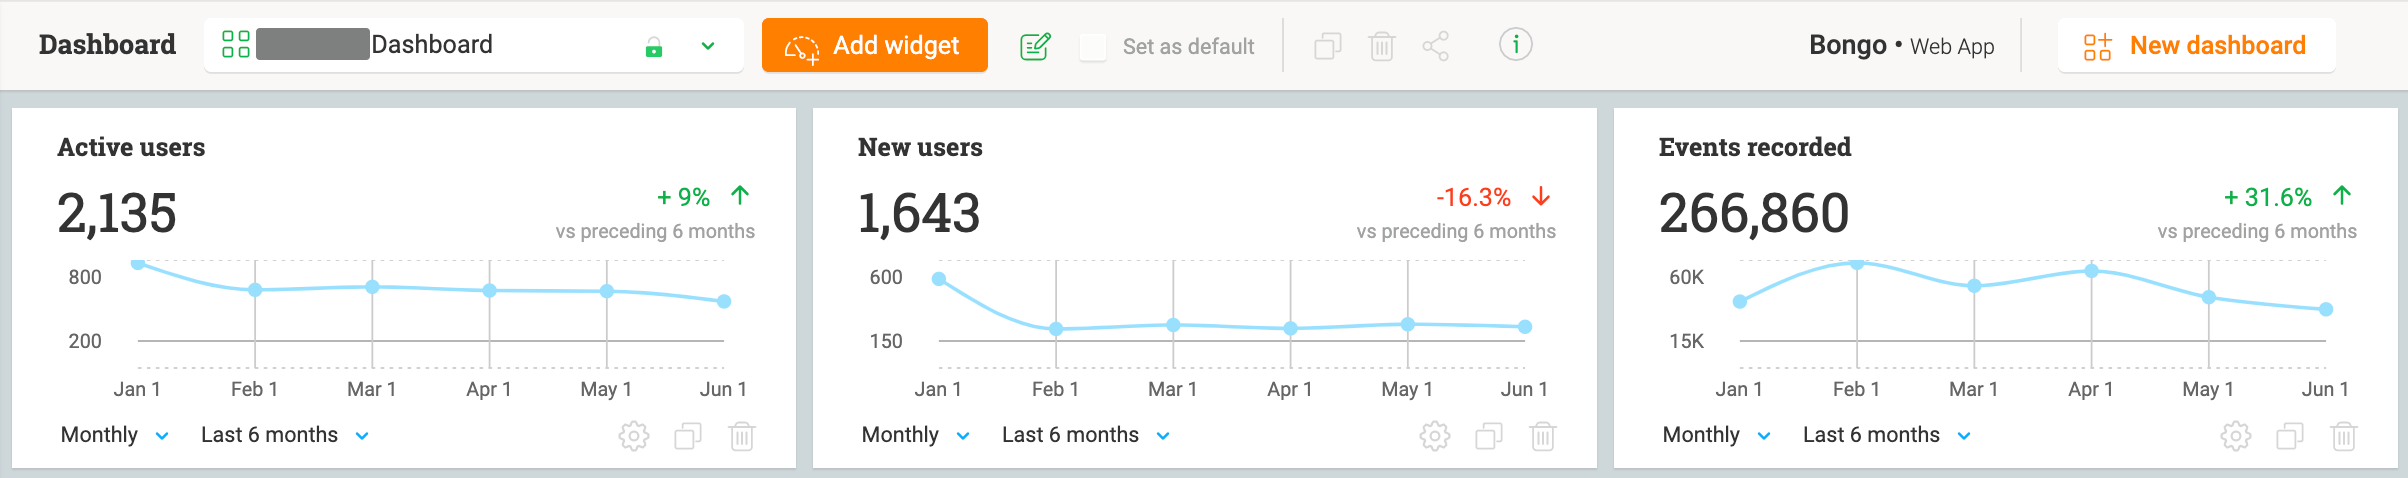
- PX Feature: Custom Dashboards (you could do this without a custom dashboard, but I took the opportunity to create a CDB since she would likely be referring to it in the future)
- Widget: New Users
- Filters: Monthly / Last 6 Months
- Settings: Added a preset Public Filter for this partner, but this could easily be an account name or something like that
- PX Feature: Custom Dashboards
- Widget: Active Users
- Filters: Monthly / Last 6 Months
- PX Feature: Custom Dashboards
- Widget: Events Recorded
- Filters: Monthly / Last 6 Months
- Note: The way I've explained "events" to my colleagues is that they are page views / button clicks (I know it goes beyond this, but that's the best way I have to describe our current view), and a report of total events over time is a good way to see levels of overall activity. For example, we found that our events recorded for the last 6 months for this partner increased 31.6% compared to the preceding 6 months, which is a good indicator of increasing activity levels. Anyone have better ideas on how to explain that?
- 6: What do the most frequent users do when they are in our product?
- PX Feature: Audience Explorer + Analytics > Features > Adoption
- Audience Explorer: [list]
- Filter: [list]
- Account Filter > Integration Type = [partner name] (this is a custom attibrute in GPX for us, could be filtered to account name)
- Sort by: Number of visits Z>A
- I saw that for this partner, the top 13 visitors had been into our product more than 100 times. So I used that as my parameter to define a frequent user. I'm sure this could be defined in more nuanced ways, but that's what I did for now.
- I kept this view open, then opened a new window on my other monitor.
- Filters:
- Account Filter > Integration Type = [partner name]
- Users Filter (set to OR) > User Identifier is: [list]
- Here I copied and pasted the user identifiers for the top 13 users from the view in Audience Explorer.
[/list]
[/list]
Hope this is helpful to others!


