Idea: Quickly Uncheck All Categories in Graphs

Related products: CS Reports & Dashboards

We currently have a report in C360 page that shows application usage by Department and Title, week-over-week;


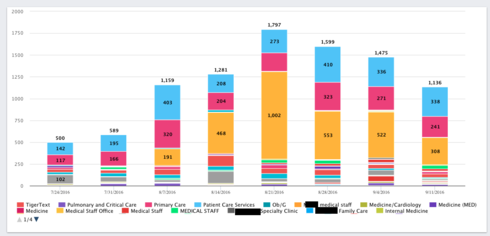
For those customers that have 10's, 100's of different departments using our app, the CSMs would like to quickly highlight certain departments and see their usage as seen below;


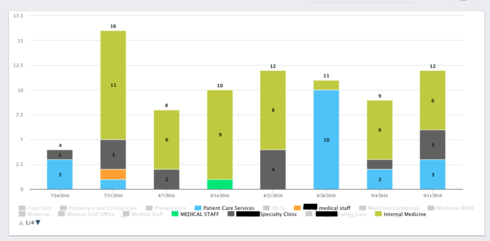
However, in order to do this they first need to uncheck all the categories first. They'd like to have a button that would uncheck all of the categories so it does not need to be performed one-by-one.


Please feel free to let me know if you have any questions.
Perhaps the ability to group values into buckets (like what your can do in SFDC reporting) would solve?  This would really help our reporting capabilities.
I would looove this too, sometimes I have many measures that I would like to group into categories, to improve readability in graphs. This would be amazing to have!
Good UX feedback to add 'uncheck all' in the filters drop down for picklists. Should be fairly simple change; will add it queue. 


Sara, your comment of group values buckets make sense as well. Will help with this but also that itself is an important use case. We are currently spec'ing out 'dynamic formulae' and expect to be on of the core use cases.