
Rough examples attached.
If you ever had a profile with us, there's no need to create another one.
Don't worry if your email address has since changed, or you can't remember your login, just let us know at community@gainsight.com and we'll help you get started from where you left.
Else, please continue with the registration below.
Enter your username or e-mail address. We'll send you an e-mail with instructions to reset your password.

Thanks for your feedback. I've added your suggestion to the roadmap. Timing is TBD.
Thanks,
Sumesh
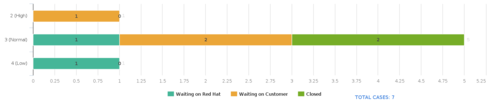
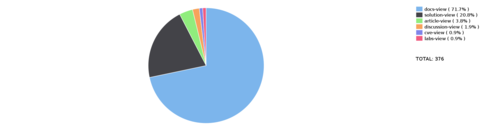
While we don't display the totals for pie charts, we do display the totals(On selecting show data points from Gear icon|Chart options) for stacked bar and column charts. Can u please cross check and raise an issue if that isn't the case?
Thanks,
Sumesh
Thanks!