This is a key part of our executive and management dashboard and there is not a current chart option that gets this point across.
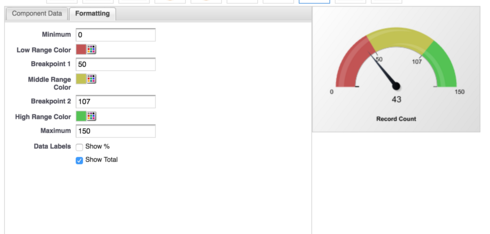
Along with the gauge chart option, you would also need to be able to specify the min/max/middle values. Ability to choose the colors would also be very helpful!